


Managing a business often feels like juggling numerous tasks, from attracting customers to boosting revenue. But here’s a hard truth: most brands are flying blind when it comes to understanding what’s actually happening with their customers after the sale.
You can obsess over vanity metrics like likes, follows, page views, but if you’re building a serious D2C brand, one framework matters infinitely more: Cohort Analysis.
Cohort analysis helps you understand customer behavior over time by grouping them based on shared characteristics or actions. This allows you to track key patterns that impact metrics like retention, lifetime value, and conversion rates, enabling smarter, data-driven decisions for long-term success.
Unlike averaging all customers together (which hides critical trends), cohort analysis lets you zoom into specific customer batches and see what’s really happening underneath the surface.
The stakes are real:
- A 5% increase in retention can boost profits by 25–95%
- Companies using advanced cohort analysis see 25% higher customer lifetime value
- Holiday cohorts typically show 40-60% lower retention rates than year-round customers,s but certain segments exceed standard retention rates by 61%
In this comprehensive guide, you’ll learn the 10 essential metrics to track in cohort analysis, implementation strategies from leading D2C brands, and actionable frameworks to increase retention, improve customer lifetime value, and refine marketing strategies.
KEY TAKEAWAYS
- Retention beats acquisition: A 5% retention improvement boosts profits by 25-95%. Cohort analysis reveals where retention actually breaks.
- CAC: CLV ratio is your profitability lens: Not all customers are equal. Shift budget to channels with 1:5+ CAC: CLV ratios, away from those below 1:3.
- First 7 days determine lifetime value: Day 1 retention is 65-75%, Day 7 drops to 35-45%. Optimize onboarding harder than acquisition.
- Seasonal & behavioral segments hide 2-3x variation: Holiday cohorts have 40-60% lower retention than year-round. Fast adopters have 2.25x CLV of slow adopters. Personalize.
- Predictive churn prevention beats reactive recovery: Use behavioral signals (email decline, purchase frequency drop, site visits) to predict and prevent churn before it happens.
- Start simple, scale smart: Month 1—baseline metrics. Month 2—identify winners. Month 3—optimize leaks. Month 4+—behavioral segmentation
Part 1: Mastering the 10 Essential Cohort Analysis Metrics
Metric #1: User Retention Rate – The Foundation of Sustainable Growth
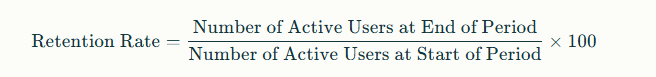
Definition & Formula:
User retention rate indicates the percentage of customers who continue to use your product or service over a defined time. It reveals how well you’re keeping customers engaged beyond their first purchase.
Why This Matters for D2C Brands:
Retention is the cornerstone of D2C profitability. Maintaining existing customers is often 5–25 times cheaper than acquiring new ones. Retention analysis reveals critical insights:
- Product-Market Fit Indicator: High retention signals that your product genuinely solves customer problems
- Customer Satisfaction Mirror: Retention curves directly correlate with satisfaction and perceived value
- Revenue Predictor: Retention patterns predict long-term growth sustainability
Strategic Implementation for D2C:
- Segment by Acquisition Channel
- Compare retention rates for customers acquired via paid ads, organic search, social media, and influencer partnerships.
- Example: A D2C wellness brand discovered that customers from their email funnel had 45% higher 30-day retention than paid social customers
- Track Milestone Retentions
- Day 1 retention (immediate engagement)
- Day 7 retention (first week check-in)
- Day 30 retention (decision to repurchase)
- Day 90+ retention (customer loyalty threshold)
- Personalization by Cohort
- Implement personalized emails/product recommendations for cohorts showing early churn signals.
- A/B test different onboarding sequences for different acquisition sources
- Onboarding Optimization
- Identify friction points where users disengage
- Test simplified checkout processes, guided product tours, or welcome sequences.
- CohortAnalysis data showed that users completing 5+ onboarding steps within 3 days had 30% higher retention rates.
Case Study: How BukuKas & Calm Improved Retention with Cohort-Driven Onboarding
Calm, the meditation app, used cohort analysis to segment users by acquisition source and onboarding completion. They discovered that users who completed their first 10-minute meditation within 24 hours had 85% higher 30-day retention. By redesigning their onboarding to guide users to this “aha moment” faster, they increased overall retention by 18% within 3 months.
Metric #2: Churn Rate – Identifying the Leaks in Your Revenue Tank
Definition & Formula:
Churn rate is the percentage of customers who stop using your product within a specific timeframe. It’s often considered the inverse of retention rate—while retention tells you who stays, churn tells you who leaves.

Why Churn Analysis is Critical:
Churn is the silent killer of D2C growth. It doesn’t get the attention that acquisition does, but a 2% monthly churn rate will eliminate 22% of your customer base annually. Understanding when and why customers leave is essential.
Root Causes of Churn by Customer Cohort:
- Product Dissatisfaction – Customer didn’t experience the promised value
- High Pricing – Price-to-value ratio misalignment
- Poor Customer Experience – Friction in onboarding, support, or UX
- Better Alternatives – Competitor switching
- Life Changes – Seasonal/circumstantial factors (especially holiday cohorts)
Cohort-Based Churn Analysis Strategy:
- Identify Problem Cohorts
- Which acquisition channels show the highest churn?
- Which marketing campaigns brought low-quality customers?
- Which geographic regions churn fastest?
- Predict Churn Risk Using Behavioral Signals
- Track decreased engagement (fewer logins, lower order frequency)
- Monitor feature abandonment
- Flag price-sensitive customers vs. loyal ones
- Implement Targeted Re-engagement Campaigns
- Send personalized win-back offers to at-risk cohorts
- Create segment-specific messaging addressing identified pain points
- Example: For customers showing churn after 45 days, send a timely re-engagement email with 15% discount specific to their purchase history
- Root Cause Analysis Through Feedback
- Survey churned customers: “Why did you leave?”
- Use cohort analysis to identify if churn reasons differ by acquisition source.
- A SaaS platform discovered that deal-focused customers (those acquired during promotions) cited “too expensive” in churn surveys at 5x the rate of organic search customers.s
Advanced Churn Strategy: Holiday Cohort Modeling
Holiday cohorts typically show dramatically different churn patterns than year-round customers:
| Cohort Type | 30-Day Retention | Typical Behavior | Reactivation Strategy |
| Deal Hunters | 8-12% | Only buy during promotions | Post-holiday flash sales, exclusive member pricing |
| Early Shoppers (November) | 22-28% | Planners, consistent buyers | Seasonal product previews, early access benefits |
| Self-Purchasers | 28-35% | Treat themselves, high LTV | Lifestyle/aspirational marketing, VIP programs |
| Gift-Only Buyers | 5-10% | Gift-giving purpose only | Seasonal re-engagement, gift guide emails |
| Gift Card Recipients | 15-20% | Redeemers in Jan, varied behaviors | Personalized product recommendations |
Metric #3: Customer Lifetime Value (CLV) – The North Star Metric for Profitability
Definition & Formula:
Customer Lifetime Value is the total revenue a customer is expected to generate throughout their entire relationship with your business. Unlike a single purchase value, CLV accounts for repeat purchases, upsells, cross-sells, and customer longevity.
CLV=Average Revenue Per User (ARPU)×Customer Lifespan (in months/years)
More Advanced CLV Formula (Accounting for Margin):
CLV=(Average Order Value×Purchase Frequency×Customer Lifespan)−(Customer Acquisition Cost + Retention Costs)
Why CLV Matters More Than You Think:
CLV is the lens through which all acquisition decisions should be viewed. If your CAC is $50 but CLV is $120, you have healthy unit economics. If CAC is $50 but CLV is $60, your growth is hollow.
Strategic CLV Analysis by Cohort:
- Channel-Based CLV Comparison
- Calculate CLV for customers acquired through different channels
- Reallocate marketing budget toward channels with the highest CLV, not the highest volume
- Real Example: A SaaS platform discovered:
- Google Ads customers: Higher volume (1,000/month), CLV = $1,500
- Content Marketing customers: Lower volume (150/month), CLV = $2,250 (50% higher!)
- Result: Shifted budget to content, increased overall CLV by 38%
- Identify High-Value Cohorts & Double Down
- Which customer segments have 2-3x the CLV of average?
- What acquisition source/messaging/product attracted them?
- Create loyalty programs and benefits exclusively for high-value cohorts
- Seasonal CLV Variations
- Holiday customers often have lower CLV than year-round customers
- Plan inventory and marketing spend accordingly
- Use seasonal cohort data to forecast annual revenue more accurately
- CLV-to-CAC Ratio Optimization
- Industry benchmark: CLV should be 3-5x CAC
- Use cohort analysis to identify if certain cohorts fall below this threshold
- These “unprofitable” cohorts need either:
- Increased retention efforts (improve CLV)
- Higher-value offerings (increase ARPU)
- Better targeting (reduce CAC)
Case Study: How Sephora Turned CLV into a Loyalty Engine
Sephora’s Beauty Insider program segments customers into CLV-based tiers:
- VIP Tier: $1,250+ annual spend → Premium perks, early access to products
- Insider Tier: $350-1,249 annual spend → Standard benefits
- Member Tier: <$350 annual spend → Basic rewards
By creating a 3-tier system, Sephora:
- Drove 80% of sales from program members
- Achieved 22% increase in cross-sell through tiered benefits
- Boosted upsell revenue by 13-51%, depending on tier
- Created emotional engagement (75% through tier progression and recognition)
Metric #4: Customer Acquisition Cost (CAC) – Understanding Your Cost of Growth
Definition & Formula:
Customer Acquisition Cost measures the total cost of acquiring a new customer, including all marketing and sales expenses, divided by the number of customers acquired.
Cohort-Based CAC Analysis:
Traditional CAC gives you an aggregate number that hides critical variations. Cohort analysis reveals:
- Which channels are truly cost-effective?
- Which campaigns waste money?
- Which customer segments are most profitable to acquire?
Channel Performance Analysis:
Track CAC by acquisition source for each cohort:
| Acquisition Channel | Volume | CAC | 30-Day Retention | CLV | CAC: C LV Ratio | Efficiency |
| Organic Search | 200/mo | $32 | 28% | $890 | 1:27.8 | ✅ Excellent |
| Email List | 150/mo | $8 | 35% | $1,150 | 1:143.75 | ✅ Outstanding |
| Paid Social (Meta) | 500/mo | $18 | 18% | $520 | 1:28.9 | ✅ Good |
| Influencer Partnerships | 100/mo | $85 | 12% | $340 | 1:4 | ❌ Unproductive |
| Content Marketing | 80/mo | $25 | 38% | $1,400 | 1:56 | ✅ Excellent |
Implementation Strategy:
- Segment CAC by Campaign Type
- Compare “awareness” campaigns vs. “conversion” campaigns
- Track CAC by offer type (free trial, discount, full-price)
- Analyze CAC by device type and geography
- Identify and Kill Unprofitable Channels
- If Influencer partnerships show CLV: CAC of 1:4 (needing 75% retention just to break even), reduce spend
- Redirect budget to channels with 1:20+ ratios
- Optimize Channel Mix Over Time
- Month 1: Balanced experiment across channels
- Month 2-3: Double down on the top 3 performers
- Month 4+: Optimize winners, test new variations
- Account for Channel Synergy Effects
- Direct comparison isn’t always fair (paid ads may support organic search rankings)
- Use multi-touch attribution to understand true channel contribution
Metric #5: Conversion Rate Optimization (CRO) Metrics – Turning Visitors into Customers
Definition:
Conversion rate indicates the percentage of visitors who complete a desired action (purchase, sign-up, or add to cart). When analyzed by cohort, it reveals which customer segments convert best and why.

Cohort-Based CRO Insights:
- Device & Platform CRO Variations
- Mobile users from paid ads: 2.1% conversion rate
- Desktop users from email: 4.5% conversion rate
- Insight: Desktop email audiences are more purchase-intent ready
- Geographic Conversion Patterns
- US-based cohorts: 3.2% average conversion
- EU-based cohorts: 2.1% average conversion (due to GDPR friction, higher prices after tax)
- Strategy: Simplify checkout for EU cohorts, consider local payment methods
- Demographic & Behavioral CRO
- First-time visitors: 0.8% conversion
- Cart abandoners (retargeted): 8.2% conversion
- Repeat visitors: 6.5% conversion
- Strategy: Invest in remarketing to cart abandoners; simpler UX for first-timers
CRO Optimization Strategy by Cohort:
- Micro-Conversion Tracking
- Add-to-cart rate (vs. purchase)
- Product detail page time spent
- Review/Q&A section engagement
- These leading indicators predict purchase conversion
- A/B Testing by Cohort
- Test checkout simplification for mobile cohorts
- Test trust signals (reviews, guarantees) for first-time visitors
- Test urgency messaging (scarcity, limited-time) for deal-seeking cohorts
- Replicate winning variations across similar cohorts
- UX Optimization for High-Intent Segments
- If cart abandoners have 8.2% conversion rate, ensure they have a friction-free checkout
- Remove optional fields, simplify payment options
- Show exit-intent discount offers
- Build Conversion Funnels by Source
- Organic search cohorts funnel: Discovery → Browse → Review → Purchase (high intent throughout)
- Paid social cohorts funnel: Click → Browse → Browse → Purchase (high early friction)
- Messaging and UX should differ accordingly
Metric #6: Average Revenue Per User (ARPU) – Optimizing Monetization Per Customer
Definition & Formula:
ARPU calculates the average revenue generated from each user during a specific period. It’s essential for subscription models and reveals how effectively you’re monetizing each customer.

Why ARPU Matters:
ARPU directly impacts CLV. If you increase ARPU by 20% through upselling/cross-selling, CLV increases 20% with no additional acquisition cost.
Cohort-Based ARPU Optimization:
- Geographic ARPU Variations
- US customers: $85 average order value
- UK customers: $92 average order value (higher discretionary spending)
- India customers: $42 average order value (price-sensitive market)
- Strategy: Premium product recommendations for UK/US cohorts; value-focused messaging for India
- Pricing Tier Analysis by Cohort
- “Budget” tier buyers: $29-49 products, 2.1 purchases/year, $68 ARPU
- “Premium” tier buyers: $79-149 products, 3.4 purchases/year, $285 ARPU
- “Luxury” tier buyers: $200+ products, 1.2 purchases/year, $240 ARPU
- Strategy: Create upgrade paths for budget buyers; maintain luxury exclusivity
- Product Category ARPU
- Customers who start with accessories: $52 ARPU
- Customers who start with core products: $127 ARPU
- Strategy: Bundle core products with accessories to boost ARPU from day one
- Subscription vs. One-Time Purchase
- Subscription ARPU: $15/month × 12 months = $180 annual
- One-time purchase ARPU: $45 one-time = $45 annual
- Strategy: Create subscription options; improve subscription retention
ARPU Improvement Tactics:
- Increase Price: Test 5-10% price increases; often revenue-positive if retention stays stable
- Bundle Products: “Buy 3, Save 20%” increases average order value
- Upsell & Cross-sell: Recommend complementary products at checkout
- Loyalty Program Tiers: Higher tiers get exclusive, higher-margin products
Metric #7: User Engagement Metrics – Measuring Active Participation
Definition & Importance:
User engagement metrics track how actively users interact with your product: session duration, login frequency, feature usage, and time spent on key features. Increased engagement strongly predicts retention and LTV.
Research Finding: Engaged users have 10-50x higher lifetime value than disengaged users, depending on industry.
Critical Engagement Metrics by Cohort:
- Session Frequency
- Monthly active users (MAU): What % of customers use the product each month?
- Weekly active users (WAU): More predictive of loyalty
- Daily active users (DAU): Strongest engagement signal
- Cohort Example:
- Cohort A (January signup): 65% MAU, 32% WAU, 8% DAU
- Cohort B (June signup): 42% MAU, 18% WAU, 3% DAU
- Strategy: January cohort is healthier; study their onboarding for application to the June cohort
- Session Duration
- Average time per session (target: varies by product type)
- Time to first key action (should be <5 minutes)
- Bounce rate from key features
- Feature Adoption Cohorts
- Users who adopted Feature X within 7 days: 45% 90-day retention
- Users who never adopted Feature X: 12% 90-day retention
- Strategy: Feature X drives retention; guide all new users to discover it
- Engagement Scoring
- Assign points: Login = 1pt, Purchase = 5pts, Review left = 2pts
- High engagement (50+ pts/month): 38% retention
- Low engagement (<5 pts/month): 5% retention
- Action: Automate re-engagement emails for low-scoring cohorts
Engagement Optimization by Cohort:
- Identify Engagement-Driving Behaviors
- Which cohorts have the highest engagement?
- What specific features do they use?
- Are there shared characteristics (geography, acquisition channel, product category)?
- Gamification for Engagement
- Points/badges for completing actions (e.g., “Complete your profile” = 50 points)
- Leaderboards for competitive users
- Streak-based rewards (e.g., “Order 3 months in a row” = 20% discount)
- Feature-Focused Engagement Optimization
- Make high-engagement features more discoverable
- Simplify the path to adoption
- Celebrate user achievements (e.g., “You’ve made 10 purchases! You’re a VIP”)
Metric #8: Behavioral Metrics Analysis – Understanding the “Why” Behind Actions
Definition & Importance:
Behavioral metrics track the specific actions users take within your product or platform: clicks, feature usage, page navigation patterns, cart additions, and review submissions. These actions reveal intent and predict future behavior.
Why Behavioral Data Beats Demographic Data:
- Demographics tell you who the customer is
- Behaviors tell you what they value and what drives them
- Two customers from the same geography can have opposite behaviors and opposite CLVs
Critical Behavioral Cohorts:
- Feature Usage Cohorts
- “Used product reviews within 7 days”: 52% 30-day retention
- “Used comparison tool within 7 days”: 48% 30-day retention
- “Read product Q&A but didn’t use reviews”: 28% 30-day retention
- Action: Guide all new users to use reviews/comparison tools
- Cart Behavior Cohorts
- Abandoned cart cohort: High re-engagement potential via email
- Multiple-item cart builders: Higher LTV, excellent upsell targets
- Single-item quick buyers: Price-sensitive, needs urgency messaging
- Social Proof Engagement
- Customers who viewed 3+ reviews: 4.2x more likely to convert
- Customers who viewed customer photos: 3.1x more likely to repurchase
- Customers who read Q&A section: 2.8x higher retention
- Strategy: Prioritize review/UGC visibility in product feeds
- Search & Browse Behavior
- Long search session cohort: Research-driven, may want detailed comparisons
- Quick browse cohort: Impulse buyers, need a recommendation engine
- Repeat category browser cohort: Building loyalty around category; opportunity for loyalty program
- Strategy: Segment messaging and recommendations by behavior type
Behavior-Driven Segmentation Strategy:
- Create Behavioral Micro-Cohorts
- Cohort A: Views product reviews + Adds to cart + Visits checkout = High-intent buyers
- Cohort B: Views reviews + Abandons cart = Interested but price-concerned
- Cohort C: Clicks product + Bounces = Low interest
- Tailor email journeys for each cohort
- Optimize User Flow for High-Performing Behaviors
- If 15% of users trigger a “complete profile” action and those users have 60% higher retention…
- Move “complete profile” to a more prominent location
- Add micro-incentive (e.g., “Complete profile for personalized recommendations”)
- Predict Churn Using Behavioral Signals
- User stopped browsing products = Churn risk (send re-engagement email)
- User reduced purchase frequency = Churn risk (send special offer)
- User opened email but didn’t click = Engagement decline (try new messaging)
Metric #9: Acquisition Cohorts Analysis – Strategic Channel Evaluation
Definition:
Acquisition cohorts group users based on how and when they were acquired. This reveals the effectiveness of different acquisition strategies and identifies which channels bring high-quality, long-term customers.
Why Acquisition Cohort Analysis Matters for D2C:
Most D2C brands obsess over acquisition volume while ignoring acquisition quality. A channel that brings 1,000 customers with 8% retention is less valuable than a channel that brings 300 customers with 35% retention.
Acquisition Channel Cohorts to Track:
- Time-Based Acquisition (When)
- January cohort vs. July cohort
- Q4 (holiday) cohort vs. Q1 cohort
- Example: January customers have higher retention (New Year’s resolutions drive commitment) vs. Black Friday impulse buyers
- Channel-Based Acquisition (How)
- Organic search: High intent, high retention
- Paid social: High volume, medium retention
- Email: High quality, highest retention
- Influencer: Medium volume, variable quality
- Referral: High quality, highest LTV
- Campaign-Based Acquisition
- “Summer Sale” campaign cohort: Price-sensitive, lower retention
- “New Product Launch” campaign cohort: Product-enthusiast, higher retention
- “Educational Blog Post” campaign cohort: Research-driven, highest retention
- Offer-Based Acquisition
- “50% off” cohort: Lowest LTV (bargain hunters)
- “Free shipping” cohort: Medium LTV (convenience-focused)
- “Full price” cohort: Highest LTV (value-aligned customers)
Strategic Acquisition Cohort Optimization:
- Identify High-Quality Acquisition Channels
- Calculate 6-month retention and CLV for each channel cohort
- Reallocate budget from low-CLV to high-CLV channels
- Real example: Shifted 60% of budget from “Instagram ads” (3.2x CLV: CAC) to “Content marketing” (5.6x CLV: CAC)
- Test New Acquisition Channels with Cohort Framework
- Launcha new channel with a test budget
- Track as a separate cohort for 6 months
- Compare retention, CAC, and CLV to existing channels
- Scale only if it exceeds the performance baseline
- Seasonal Campaign Optimization
- December cohorts are historically low-LTV → Run retention campaigns aggressively.
- January cohorts higher-intent → Premium product positioning, higher price points.
- May cohorts summer-focused → Category-specific recommendations
- October cohorts holiday-planning → Gift bundle offerings
- Funnel Optimization by Acquisition Source
- Organic search users: Already know they want the product; simplify the path to purchase
- Paid social users: Still learning; provide product education, testimonials, guides
- Email list users: Already fans; offer exclusive deals, early access
- Tailor landing pages and email sequences accordingly
Metric #10: Product Lifetime Metrics Evaluation – Tracking Long-Term Usage Patterns
Definition:
Product lifetime metrics track how customers use your product/service over extended periods, measuring frequency, consistency, and value derived. These metrics reveal which products/features drive loyalty.
Key Product Lifetime Metrics:
- Product Repurchase Rate
- % of customers who repurchase the same product
- Example: “Protein Powder” repurchase rate: 61% within 6 months (consumable nature)
- Example: “Running Shoes” repurchase rate: 22% within 6 months (durability)
- Strategy: High-repurchase products = subscription opportunity; low-repurchase = cross-sell complementary products
- Cross-Category Purchase Rate
- % of customers who purchase from multiple categories
- Customers who bought from 1 category only: $420 LTV
- Customers who bought from 3+ categories: $1,120 LTV (2.67x higher!)
- Strategy: Create a product recommendation engine emphasizing category breadth
- Product Feature Adoption Over Time
- Track when customers first use key features
- Early adopters vs. late adopters vs. non-adopters
- Early adopters of premium features = upgrade/upsell candidates
- Customer Lifecycle Progression
- Month 1: Trial/discovery phase
- Month 2-3: Regular usage phase
- Months 4-6: Loyalty/habitual phase
- Month 7+: Advocacy/referral phase
- Different retention strategies for each phase
Product Lifetime Optimization Strategies:
- Identify Product “Aha Moments”
- Which specific product usage drives retention?
- Users who tried product X inthe first week: 56% retention
- Users who didn’t try product X: 18% retention
- Strategy: Make product X a “must-try” during onboarding
- Improve Feature Adoption
- Send educational content about underutilized features
- Create tutorials on high-engagement features
- Gamify feature discovery (e.g., “unlock premium features by using 5 core features”)
- Build Consumption Patterns
- Create subscription models for high-repurchase products
- Example: Offer “Protein Powder subscription” (auto-replenish monthly) at 15% discount
- Converts one-time buyers into recurring revenue
- User Education Throughout Lifecycle
- Month 1: Feature onboarding, quick wins
- Month 2-3: Advanced tips, optimization guides
- Month 4-6: Community engagement, user stories
- Month 7+: VIP perks, exclusive access, referral rewards
Part 2: Advanced Strategy Implementation for D2C Brands
Strategy #1: Seasonal Cohort Analysis – Optimizing for Natural Market Rhythms
Why Seasonality Matters:
Not all customers are created equal. Seasonal variations dramatically affect retention, LTV, and optimal retention strategy.
Seasonal Cohort Patterns:
| Season | Customer Motivation | Typical Behavior | Retention Challenge | Strategy |
| Q4 Holiday | Gift-giving, self-treat, resolutions | High initial volume, impulse purchases | 40-60% lower retention | Aggressive post-holiday retention campaigns, exclusive member benefits |
| Q1 (Jan-Mar) | New Year’s resolutions, spring refresh | High-intent, committed to change | Higher retention (25-35%) | Premium product positioning, loyalty program enrollment, and educational content |
| Q2 (Apr-Jun) | Summer prep, outdoor activities, events | Moderate volume, category-specific | Moderate retention (18-25%) | Category-focused campaigns, seasonal product launches, travel-related bundling |
| Q3 (Jul-Sep) | Back-to-school, fall refresh, vacation carryover | Declining volume as summer ends | Lower retention (12-20%) | Flash sales, clearance strategies, VIP member-only previews |
Strategy #2: Behavioral Segmentation & Predictive Churn Prevention
The Problem with Age-Based Cohorts Alone:
Grouping customers only by signup date misses critical behavioral variations. Two customers who signed up on the same day can have opposite behaviors and retention trajectories.
Building Behavioral Micro-Cohorts:
- Activation Speed Cohort
- Fast adopters: Made first purchase within 7 days of signup → 52% 90-day retention
- Slow adopters: Made first purchase after 30 days → 28% 90-day retention
- Non-purchasers: Signed up but never purchased → <5% lifetime value
- Spending Velocity Cohort
- High-velocity spenders: $200+ spent in first 30 days → $1,800 CLV
- Moderate-velocity: $50-200 in first 30 days → $680 CLV
- Low-velocity: <$50 in first 30 days → $180 CLV
- Engagement Pattern Cohort
- High-engagement: Opens 70%+ of marketing emails, visits site 2+ times/week → 62% 6-month retention
- Medium-engagement: Opens 30-70% of emails, visits site weekly → 35% retention
- Low-engagement: Opens <30% of emails, visits sporadically → 12% retention
Strategy #3: Customer Acquisition Strategy Optimization Through Cohort Lens
Step 1: Audit All Acquisition Channels
For each channel, calculate:
- Volume (customers acquired/month)
- CAC (cost per customer)
- 30-day retention rate
- CLV (6-month or annual)
- CAC: CLV ratio (ideal: 1:5 or higher)
Step 2: Identify “Problem” Channels
Example Analysis:
| Channel | Monthly Volume | CAC | 30-Day Retention | CLV | CAC: CLV |
| Organic Search | 200 | $18 | 32% | $950 | 1:52.8 |
| 120 | $2 | 48% | $1,420 | 1:710 | |
| Paid Social | 800 | $22 | 15% | $380 | 1:17.3 |
| Influencer | 60 | $95 | 8% | $180 | 1:1.9 |
| Content Marketing | 40 | $35 | 44% | $1,680 | 1:48 |
Decision: Influencer channel (1:1.9 ratio) is breaking unit economics. Need to either:
- Reduce spend and accept lower volume
- Work with influencers to improve targeting/messaging for better retention
- Eliminate channel and reinvest in higher-ROI channels
Step 3: Test & Scale Winner Channels
Current allocation: 50% Paid Social | 25% Email | 15% Organic | 10% Other
Proposed allocation based on cohort analysis:
- Move 15% from Paid Social to Email (higher retention, higher CLV)
- Increase organic efforts (content, SEO)
- Reduce influencer to testing-only budget
Test new channels with 5-10% budget allocation for 3 months, track as separate cohorts, and scale only winners.
Step 4: Optimize Within-Channel Messaging
Example: Within the “Paid Social” channel, test different creatives by cohort:
- Creative A (Lifestyle messaging): 1,200 impressions, 85 clicks, 12 purchases, CAC = $22, 20% retention
- Creative B (Product-focused messaging): 1,100 impressions, 110 clicks, 18 purchases, CAC = $15, 28% retention
- Creative C (Social proof/reviews messaging): 950 impressions, 72 clicks, 15 purchases, CAC = $18, 32% retention
Result: Creative C drives higher retention (32% vs. 20%) despite slightly lower initial conversion. Scale Creative C.
Strategy #4: Onboarding Optimization for Maximum Activation & Early Retention
The Critical Window: First 7 Days
- Day 1 retention: 65-75% (everyone who signs up)
- Day 7 retention: 35-45% (those who experienced value)
- Day 30 retention: 15-25% (those who developed a habit)
The activation rate benchmark: 25-30% good, 34%+ excellent
Onboarding Cohort Analysis:
- Define Activation Success
- For e-commerce: First purchase within 14 days
- For SaaS: Completed setup + used core feature
- For subscription: Made first renewal
- Track: % of each cohort hitting activation event by Day 7, 14, 30
- Identify Onboarding Friction Points
- Cohort A (2-step signup): 48% activation rate
- Cohort B (5-step signup): 31% activation rate
- Cohort C (1-step + guided tour): 57% activation rate
- Action: Test Cohort C’s approach (guided tour) as standard
- Personalization by Cohort
- First-time e-commerce customer: Show product guides, reviews, and size charts
- Returning customer (new login cohort): Show personalized recommendations, loyalty rewards
- Mobile vs. desktop: Different UI optimizations
- Geographic cohort: Localized language, currency, shipping options
- Onboarding Messaging by Acquisition Source
- Email subscribers: Already know brand; show product variety, loyalty benefits
- Paid ad cohort: Still learning; show social proof, benefits, guarantees
- Organic search cohort: Problem-aware; show detailed product information, comparisons
Advanced Formulas & Calculations
Formula 1: Cohort Retention Table Calculation
For a cohort acquired on January 1:
| Day | Users at Start | Users Active Today | Retention Rate |
| Day 0 | 1,000 | 1,000 | 100% |
| Day 1 | 1,000 | 720 | 72% |
| Day 7 | 1,000 | 450 | 45% |
| Day 30 | 1,000 | 280 | 28% |
| Day 60 | 1,000 | 140 | 14% |
| Day 90 | 1,000 | 85 | 8.5% |
Observation: Sharp drop from Day 1 to Day 7 (45% loss). This is the critical “onboarding failure” window. Optimization focus here has the highest ROI.
Formula 2: Cohort CLV Calculation with Seasonal Adjustment

Insight: January cohort CLV is 2.25x higher despite similar CAC. This justifies more aggressive retention spending for January cohorts.
Formula 3: Churn Prediction Risk Score
Create a composite churn risk score:
Risk Score=(0.4×Email Engagement_Decline)+(0.3×Purchase Frequency_Decline)+(0.3×Site Visit Decline)
Where each component is scored 0-10:
- 0 = no decline (healthy)
- 10 = complete inactivity (high risk)
Score >5 = High churn risk; trigger re-engagement campaign
Formula 4: Seasonal Cohort Adjustment Factor
Calculate how seasonal cohorts vary from baseline:
Example:
- Annual average 30-day retention: 22%
- Q4 (holiday) cohort 30-day retention: 13%
- Adjustment factor: 13 ÷ 22 = 0.59 (59% of baseline)
This tells you holiday cohorts have 41% lower retention than average, requiring targeted interventions.
CONCLUSION
Cohort analysis is the difference between guessing and knowing. While most D2C brands chase vanity metrics, those tracking these 10 metrics see 25% higher CLV and build sustainable, profitable growth.
The path is simple: segment customers by cohort → identify patterns → personalize strategies → scale what works. Start with one cohort analysis today. Calculate retention, CLV, and CAC for your best acquisition channel. Compare to others. That single insight will reshape your strategy for the next 6 months.
Cohort analysis isn’t complexity—it’s clarity. And clarity compounds into profitability
Q1: What is cohort analysis and why does it matter for D2C brands?
A: Cohort analysis groups customers by shared characteristics (signup date, acquisition channel, behavior) to track patterns over time. It matters because it reveals what “average” metrics hide—a brand’s overall 20% retention might mask 45% retention in one cohort and 8% in another. This visibility enables targeted optimization and prevents decisions based on misleading averages.
Why D2C cares: In D2C, profitability depends entirely on retention and LTV. Cohort analysis identifies which customer segments are worth acquiring and which require different strategies.
Q2: How do I choose which metrics to track if I’m just starting?
A: Start with the “big 3”:
- Retention rate (% of customers still active after 30/60/90 days)
- CLV (total revenue per customer over lifetime)
- CAC (acquisition cost per customer)
Calculate these for each of your top 3 acquisition channels. The gaps between channels will reveal your highest-ROI optimization opportunity. Once this becomes routine (2-3 months), layer in churn rate and engagement metrics.
Q3: What’s the difference between retention rate and churn rate?
A: They’re inverse metrics:
- Retention rate = % of customers still active (higher is better)
- Churn rate = % of customers who left (lower is better)
If 70% of a cohort stays active, that’s 70% retention and 30% churn. Track both—retention shows health, churn identifies problems needing urgent attention.
Q4: How do I calculate Customer Lifetime Value (CLV)?
A: Simple formula:
CLV=(AverageOrderValue×PurchaseFrequency×Avg.CustomerLifespan)−(CAC+RetentionCosts)
CLV=(AverageOrderValue×PurchaseFrequency×Avg.CustomerLifespan)−(CAC+RetentionCosts)
Example:
- Avg order value: $85
- Purchase frequency: 3x/year
- Customer lifespan: 4 years
- CLV = ($85 × 3 × 4) – ($30 CAC + $20 retention) = $1,000
Calculate CLV by cohort (by channel, season, behavior) to identify which segments drive profitability.
Q5: What’s a good CAC:CLV ratio?
A:
- 1:5 or higher = Excellent (5+ year payback period, highly profitable)
- 1:3 to 1:5 = Healthy (3-5 year payback, sustainable growth)
- 1:2 to 1:3 = Concerning (breakeven in 2-3 years, requires optimization)
- Below 1:2 = Critical (unprofitable channel, needs fixing or elimination)
If a channel’s ratio drops below 1:3, either reduce CAC (improve targeting) or increase CLV (better retention/upsells).
Q6: Why do seasonal cohorts (like holiday customers) perform differently?
A: Holiday cohorts have fundamentally different motivations:
- Deal hunters buy only during promotions (low retention, low CLV)
- Gift buyers have no repeat intent (5-15% retention)
- New Year’s customers have high commitment/resolution intent (higher retention)
Holiday cohorts typically show 40-60% lower retention than year-round customers. Strategy: Aggressive post-holiday retention campaigns, exclusive member benefits, and realistic revenue projections for Dec-Jan cohorts.
Q7: What behavioral signals predict churn?
A: Track these red flags—when they occur, churn risk is high:
- Email engagement decline (open rates drop 50%+)
- Purchase frequency drop (intervals double from 2 weeks to 4 weeks)
- Site visit reduction (visits/month drop significantly)
- Feature abandonment (customer stops using key features)
- Support tickets increase (frustration signals)
Create a churn risk score combining these signals. Customers scoring >5/10 should receive immediate re-engagement campaigns (personalized offers, win-back emails, VIP perks).
Q8: How does onboarding optimization impact retention?
A: Drastically. The first 7 days are critical:
- Day 1 retention: 65-75%
- Day 7 retention: 35-45%
- Day 30 retention: 15-25%
Best practices:
- Guide users to “aha moment” (first key feature adoption) within 24 hours
- Simplify signup (fewer steps = higher activation)
- Personalize onboarding by cohort (email subscribers vs. paid ads need different approaches)
- Track activation (% hitting key milestone) by cohort
Example: Calm’s onboarding: Users completing first 10-minute meditation in 24 hours had 85% higher 30-day retention. They redesigned to guide users there faster → 18% overall retention improvement.
Q9: Should I focus on acquisition or retention?
A: Retention, hands down. Here’s why:
- Acquiring a new customer is 5-25x more expensive than retaining existing ones
- A 5% retention increase boosts profits by 25-95%
- Retention compounds (Month 1 improvement affects Month 6 revenue)
Allocation strategy:
- Months 1-2: 70% budget on acquisition (build base)
- Months 3-6: 50% acquisition, 50% retention (stabilize)
- Months 6+: 40% acquisition, 60% retention (mature business)
Cohort analysis enables this shift by identifying exactly where retention is breaking and how to fix it.
Q10: How do I implement cohort analysis without advanced tools?
A: You need three things:
- Customer data (Shopify, WooCommerce, or email platform)
- Google Analytics 4 (free, tracks behavior)
- Google Sheets (calculate cohort tables and formulas)
30-minute setup:
- Export customer list with signup date and acquisition source
- Create simple cohort retention table in Sheets
- Calculate retention % for each cohort at Day 7, 30, 60, 90
- Compare cohorts visually
- Identify top performer and bottom performer
- Brainstorm 3 optimization ideas per cohort
No Mixpanel. No Amplitude. No complex tech stack needed.