

Here’s a surprising truth most businesses miss: 75% of companies using predictive analytics report improved customer retention rates, yet the majority still haven’t optimized for the metric that actually drives long-term profitability.
In 2025-2026, the business landscape is shifting dramatically. Acquisition costs are climbing, customer expectations are rising, and the bar for sustainable growth is higher than ever. Amid this turbulent landscape, one metric stands out as a beacon of strategic clarity: Customer Lifetime Value (CLV)—the total revenue you can expect from a single customer throughout your entire relationship.
This isn’t just another vanity metric. CLV represents the fundamental health of your customer relationships and directly impacts every major business decision: how much to invest in acquisition, which channels to prioritize, what products to develop, and how to allocate your limited resources. Companies that master CLV measurement don’t just survive in today’s competitive market—they thrive.
The problem? Most businesses calculate CLV incorrectly, or worse, don’t measure it at all. They remain fixated on short-term metrics like conversion rates and daily sales while ignoring the long-term financial impact of their customer relationships. This tunnel vision costs them millions in wasted marketing spend and missed growth opportunities.
This comprehensive guide will walk you through everything you need to know about measuring CLV, why it matters, and exactly how to use it to transform your business in 2026. Whether you’re managing a Shopify store, running a D2C brand, or scaling a subscription business, the principles and strategies in this guide will directly impact your bottom line.

Key Takeaways
- Profit Over Revenue: In 2026, measuring revenue-based CLV is no longer enough. To survive rising costs, businesses must calculate Profit-based CLV to understand the true bottom-line impact of each customer.
- The 3:1 Rule: Your “vital sign” is the CLV: CAC ratio. Aim for a 3:1 ratio; anything below 1:1 means you are losing money on every customer you acquire.
- Retention is More Profitable than Acquisition: It is 5x more expensive to acquire a new customer than to keep an existing one. Improving retention by just 5% can increase average customer lifespan by nearly 50%.
- Small Changes Compound: CLV is driven by three pillars: Average Order Value (AOV), Purchase Frequency, and Lifespan. Even minor increases in AOV (through upselling) or Frequency (through loyalty programs) lead to exponential growth in lifetime value.
- Predictive AI is the New Standard: Moving from historical data to Predictive CLV allows businesses to identify high-value customers early and intervene before at-risk customers churn.
- First-Party Data is Non-Negotiable: With the decline of third-party cookies, building a robust Email and CRM database is essential for accurate CLV tracking and personalized marketing.
- CLV is a Culture, Not Just a Metric: Success requires moving CLV from the marketing department to the entire organization, influencing everything from product development to finance and customer support.
What is Customer Lifetime Value (CLV)? A Clear Definition
Customer Lifetime Value (CLV) is the total net profit a business predicts it will earn from a customer throughout their entire relationship with the brand. It extends far beyond a single transaction or first-year revenue—it encompasses the complete financial value of a customer from their initial purchase until they stop being a customer.
CLV vs. LTV: Clearing Up the Confusion
You’ll frequently see CLV, LTV, and CLTV used interchangeably in marketing literature. They mean the same thing: the total revenue or profit generated by a customer over time. For consistency, we’ll use CLV throughout this guide, but know that if you encounter these acronyms elsewhere, they’re referring to the same concept.
Why This Distinction Matters: Revenue vs. Profit
Here’s a critical nuance: some definitions focus on total revenue from a customer, while others focus on net profit after accounting for costs. For strategic business decisions, profit-based CLV is far more valuable because it tells you the actual bottom-line impact of customer relationships, not just the surface-level revenue they generate.
For example, a customer might generate $1,000 in revenue but only $200 in profit after accounting for acquisition costs ($120), annual retention costs ($30), and product costs ($650). This profit-based view fundamentally changes how you allocate resources.
Why CLV Matters: The Strategic Imperative for 2026
The Cost of Getting Acquisition Wrong
Here’s a statistic that should grab your attention: it costs approximately five times more to acquire a new customer than to retain an existing one. Despite this well-documented fact, most businesses continue to chase new customers relentlessly while neglecting the goldmine of value sitting right in front of them.
This acquisition-focused mentality creates a leaky bucket scenario. You’re constantly filling your business with new customers while watching existing customers slip away unappreciated. Meanwhile, your customer acquisition costs (CAC) climb higher each year as market competition intensifies.
CLV Changes Your Strategic Lens
Understanding CLV reframes your entire business strategy:
From Short-Term Transactions to Long-Term Relationships: Instead of asking “Can this customer purchase today?”, you ask “What will this customer be worth over the next 3-5 years?” This shift from transactional thinking to relational thinking is transformative.
From Generic Marketing to Precision Targeting: When you know that customers acquired through your email channel have a 40% higher CLV than those from paid ads, you can reallocate budget intelligently. When you discover that certain product categories attract higher-CLV customers, you optimize your mix accordingly.
From Intuition to Data-Driven Decisions: Instead of debating whether to invest in customer service or loyalty programs, CLV analysis shows you exactly which levers will generate the highest ROI for your business.
The Business Impact: By the Numbers
- Revenue Forecasting Precision: Accurate CLV predictions enable more realistic financial planning, better inventory management, and informed expansion strategies.
- Marketing ROI Optimization: By understanding CLV, you can determine how much you can afford to spend on customer acquisition without compromising profitability.
- Customer Segmentation: CLV reveals which customer segments are truly valuable, allowing you to tailor marketing efforts, pricing, and product offerings to maximize profit from each group.
- Competitive Advantage: Companies that prioritize CLV build stronger, more loyal customer bases and outpace competitors focused solely on transaction volume.
The CLV Formula: From Simple to Advanced
The Simple CLV Formula (Best for Beginners)
Let’s start with the most accessible approach. The simple CLV formula multiplies three key metrics:
CLV = Average Purchase Value (APV) × Purchase Frequency (PF) × Average Customer Lifespan (L)
Breaking Down Each Component:
Average Purchase Value (APV): The typical amount a customer spends per transaction.
- Formula: Total Revenue ÷ Total Number of Orders
- Example: $100,000 revenue ÷ 1,000 orders = $100 APV
Purchase Frequency (PF): How often the average customer purchases within a given period (usually annually).
- Formula: Total Orders ÷ Unique Customers
- Example: 1,000 orders ÷ 500 unique customers = 2 purchases per customer per year
Average Customer Lifespan (L): The average duration in years that a customer continues purchasing from your brand.
- Typical estimate: 2-5 years, depending on industry
- Example: Average customer stays 3 years
Putting It Together—A Real-World Example:
Imagine you run an online clothing store with the following metrics:
- Average Purchase Value: $75
- Purchase Frequency: 4 purchases per year
- Customer Lifespan: 3 years
Calculation: $75 × 4 × 3 = $900 CLV
This means each customer generates, on average, $900 in revenue over their lifetime with your store. Can you now make smarter decisions? Is spending $150 to acquire a customer worth it if they’ll generate $900? Yes—you get a 6x return. Is paying $25 per year in retention costs justified? Absolutely.
The Three Pillars of CLV: How Customer Value is Built
[chart:52]
The Traditional CLV Formula (Adding Profit Margins)
While the simple formula is useful, it only shows revenue, not profit. The traditional formula adds profit margin, giving you a clearer picture of actual bottom-line impact.
CLV = (APV × PF × L) × Profit Margin %
Why This Matters: A $900 CLV looks good until you realize your profit margin is only 20%, which means the actual CLV is $180. This profit-based perspective prevents you from overspending on customer acquisition.
Practical Example:
Using our clothing store:
- Revenue-based CLV: $900
- Profit Margin: 25% (after product costs, shipping, etc.)
- Profit-based CLV = $900 × 0.25 = $225
Now you know you can safely spend up to roughly $75-100 on acquisition ($225 ÷ 3 = $75 for a healthy 3:1 ratio) and remain profitable.
The Advanced Formula (Accounting for Customer Costs)
For a more accurate profitability assessment, the advanced formula subtracts acquisition and retention costs:
CLV = (APV × PF × L) − (Customer Acquisition Cost + Annual Retention Cost × L)
Example with Full Costs:
- Average Purchase Value: $75
- Purchase Frequency: 4 per year
- Customer Lifespan: 3 years
- Acquisition Cost: $100
- Annual Retention Cost: $20
Calculation: ($75 × 4 × 3) − ($100 + $20 × 3) = $900 − $160 = $740 Net CLV
This formula reveals the true profitability of your customer relationships after all investments are accounted for.
Predictive CLV: The Future-Focused Approach
For businesses with substantial historical data, predictive CLV models use machine learning to forecast future customer behavior with remarkable accuracy.
Predictive Formula (simplified):
CLV = Σ (Predicted Revenue × Predicted Margin × Survival Rate) / (1 + Discount Rate)^t
This approach factors in:
- Survival Rate: Probability the customer remains active
- Discount Rate: Time value of money
- Behavioral Patterns: Historical purchase trends, seasonal variations, churn indicators
Advanced companies like Salesforce and HubSpot use AI-powered predictive CLV models that update in real-time, enabling dynamic marketing personalization and resource allocation.

CLV Calculation Methods Comparison: Choose the Right Approach for Your Business
[chart:51]
Real-World CLV Examples Across Industries
E-commerce (Apparel)
Metrics:
- AOV: $65
- Purchase Frequency: 6/year
- Lifespan: 2.5 years
- Profit Margin: 35%
Calculation: $65 × 6 × 2.5 = $975 revenue; $975 × 0.35 = $341 profit-based CLV
Insight: With this CLV, allocating $80-100 per customer acquisition is sustainable. Seasonal campaigns and email marketing targeting this segment show strong ROI.
Subscription Services (Meal Kits)
Metrics:
- AOV: $40 per order
- Purchase Frequency: 8/year
- Average Lifespan: 2 years
- Profit Margin: 30%
Calculation: $40 × 8 × 2 = $640 revenue; $640 × 0.30 = $192 profit-based CLV
Insight: Higher churn risk in subscription models means retention investments become critical. Improving lifespan by just 6 months could increase CLV by 15%.
D2C Health & Wellness
Metrics:
- AOV: $120 (premium products)
- Purchase Frequency: 3/year
- Lifespan: 4 years
- Profit Margin: 50%
Calculation: $120 × 3 × 4 = $1,440 revenue; $1,440 × 0.50 = $720 profit-based CLV
Insight: Luxury/health product categories attract higher-value customers. Loyalty programs and educational content drive repeat purchases and longer lifespan.
The CLV-CAC Ratio: Your Business Health Indicator
While CLV tells you the value of a customer, it only becomes truly powerful when compared to your Customer Acquisition Cost (CAC). This ratio is your business’s vital sign.
The Ideal 3:1 CLV: CAC Ratio
The gold standard benchmark is a 3:1 CLV: CAC ratio, meaning every dollar spent acquiring a customer generates three dollars in lifetime value.
Calculation:
CL V: CAC Ratio = Total CLV ÷ Total CAC
What the Ratios Mean:
- Below 1:1 = Unsustainable (losing money on each customer)
- 1:1 to 2:1 = Concerning (thin margins, growth limited)
- 3:1 = Healthy (sustainable, profitable growth)
- 4:1+ = Excellent (strong competitive advantage)
Real Example:
If your CLV is $300 and your CAC is $100:
- Ratio = $300 ÷ $100 = 3:1 ✓ Healthy
If your CLV is $300 but your CAC is $200:
- Ratio = $300 ÷ $200 = 1.5:1 ✗ . Concerning—you need to either increase CLV or reduce CAC.
Why This Ratio Matters More Than Individual Metrics
Many businesses obsess over reducing CAC through cheaper advertising channels. While cost efficiency matters, it can backfire if those channels attract low-CLV customers. The ratio keeps both sides of the equation balanced.
Strategic Implication: If your 3:1 ratio is slipping, you have two levers:
- Reduce CAC (find cheaper acquisition channels)
- Increase CLV (improve retention, raise AOV, extend lifespan)
Research shows that improving CLV through retention is often 5-10x more effective than pursuing aggressive CAC reduction.
The Hidden Drivers: What Actually Influences CLV?
Understanding the CLV formula is just the beginning. To meaningfully increase CLV, you must understand the behavioral and strategic factors that drive each component.
1. Customer Engagement Levels
The most overlooked CLV driver is the depth of customer engagement with your brand.
High-Engagement Indicators:
- Regular purchases beyond seasonal patterns
- Active participation in loyalty programs
- Social media interactions and brand advocacy
- Customer reviews and referrals
- Email open rates above 25%
Impact on CLV: Engaged customers have 30-50% higher purchase frequency and stay active 2-3x longer than disengaged customers.
Action: Design engagement programs that reward interactions—points for reviews, exclusive access for email subscribers, community features for loyalty members.
2. Product/Service Value Perception
How customers perceive value directly influences repeat purchase behavior.
Value Drivers:
- Brand reputation and trust (82% of consumers prefer brands they trust)
- Quality-to-price perception
- Product reliability and durability
- Quality of customer service
- Problem resolution speed and effectiveness
Impact on CLV: Customers who perceive high value show 40-60% higher repeat purchase rates.
Action: Invest in customer reviews and testimonials, provide exceptional onboarding, deliver premium customer service, and maintain consistent product quality.
3. Purchase Frequency Drivers
What triggers repeat purchases?
Key Drivers:
- Product necessity/consumption rate
- Seasonal trends specific to your category
- Competitive positioning and differentiation
- Availability of complementary products
- Personalized recommendations and relevance
- Customer satisfaction level (NPS)
Action: Map your category’s natural repurchase cycle. For consumables, shorter cycles mean higher frequency. For discretionary items, personalization and emotional connection drive repeat behavior.
4. Retention and Churn Prevention
Customer lifespan directly correlates to churn rate. Even small improvements in retention have exponential CLV impact.
Churn Rate Impact:
- 10% annual churn → 10-year average lifespan
- 15% annual churn → 6.7-year average lifespan
- 20% annual churn → 5-year average lifespan
Improving retention by just 5% points can extend average lifespan by 40-50%.
Action: Implement predictive churn models to identify at-risk customers before they leave. Use targeted win-back campaigns for inactive customers.
The CLV Measurement Paradox: Why Accuracy Matters (But Perfection Is Impossible)
Before implementing CLV strategies, understand a critical reality: CLV is a forecast, not a guarantee. It’s based on historical patterns, but the future will differ from the past.
Common Measurement Challenges
Data Quality Issues
- Duplicate customer records across platforms
- Inconsistent tracking across devices (mobile, desktop, app)
- Incomplete purchase history
- Missing or inaccurate revenue data
- Multi-channel attribution confusion
Seasonal and Market Variations
- Holiday season spikes distort annual averages
- Industry-specific peak seasons
- Economic cycle impacts
- Changing customer preferences over time
- Competitive dynamics shifting market conditions
Technical Limitations
- Legacy systems unable to track comprehensive behavior
- Limited historical data (startups)
- Integration challenges between platforms
- Attribution across multiple touchpoints
Solutions for Greater Accuracy
- Data Governance: Implement rigorous data cleansing processes. Establish a single customer view across all platforms.
- Segmented Calculations: Calculate CLV separately for different customer cohorts rather than using a single average. Loyalty members vs. one-time buyers have drastically different CLVs.
- Rolling Averages: Use 2-year or 3-year rolling averages to smooth seasonal fluctuations rather than relying on single-year snapshots.
- Regular Recalculation: Update CLV quarterly or semi-annually as new data emerges. Avoid treating CLV as static.
- Cohort Analysis: Track CLV by acquisition channel, source, and customer segment to identify patterns and optimize targeting.
Strategic CLV Optimization: The Four Proven Levers
Now that you understand CLV measurement, how do you actually increase it? Research and practical experience reveal four primary levers that consistently drive CLV improvement.

CLV Growth Strategies: Which Levers Drive the Most Impact?
[chart:53]
Lever 1: Loyalty Programs (CLV Impact: +35%)
Strategic loyalty programs are among the most powerful CLV levers available. Evidence shows loyalty program members have 15-40% higher CLV than non-members.
Why They Work:
- Incentivize repeat purchases directly
- Increase purchase frequency by creating rewards-based motivation
- Extend customer lifespan by building habit loops
- Increase AOV through tiered rewards and exclusive offers
- Create an emotional connection beyond a transactional relationship
Implementation Best Practices:
Tiered Structure: Design reward tiers (Bronze, Silver, Gold) that encourage customers to increase spending and engagement to unlock higher benefits.
Example:
- Bronze (0-100 points): 1 point per $1 spent
- Silver (100-250 points): 1.25 points per $1 spent + exclusive sales access
- Gold (250+ points): 1.5 points per $1 spent + early product access + birthday gifts
Outcome: A fashion brand implementing tiered loyalty saw 22% increase in repeat purchase rate and 18% increase in average order value among members.
Emotional Rewards: Beyond monetary incentives, loyalty programs should offer status, exclusivity, and community.
- Early access to new products
- Members-only events or communities
- Personalized shopping experiences
- Recognition and celebration of milestones
Mobile-First Design: 65% of loyalty program interactions happen on mobile devices. Your program must be seamlessly integrated into your app/mobile site.
Lever 2: Personalization & Strategic Upselling (CLV Impact: +28%)
Personalized product recommendations and strategic upselling can increase CLV by driving both higher purchase frequency and increased average order value.
The Personalization Framework:
Behavioral Personalization: Present recommendations based on browsing and purchase history.
- “Customers who bought X also bought Y.”
- Product recommendations on product pages
- Post-purchase email recommendations
- Retargeting campaigns with specific products
Contextual Personalization: Adjust offers based on customer stage and context.
- Welcome series for new customers (onboarding)
- Browse abandonment: “We still have that item for you.u”
- Cart abandonment: Quick checkout reminder + incentive
- Post-purchase: Complementary products
Predictive Personalization: AI predicts the customer’s next action.
- “Ready for your next order?” campaigns (based on repurchase cycle)
- Predictive churn prevention (“We miss you” offers)
- Next-size recommendations for apparel
- Seasonal trigger-based offers
Upselling Strategy: Present premium versions or quantities at checkout.
Before-and-after example:
- Without upselling: Customer buys $50 item → $50 AOV
- With strategic upselling: Customer buys $50 item + upgrade recommendation → $65 AOV
This 30% increase compounds over the lifetime: 5 purchases × $50 = $250 vs. 5 purchases × $65 = $325. That’s $75 more per customer.
Lever 3: Exceptional Customer Service (CLV Impact: +32%)
While harder to quantify than loyalty programs, exceptional service extends customer lifespan dramatically.
Key Service Metrics That Impact CLV:
- Response Time: 24-hour response targets reduce churn by 15-20%
- First-Contact Resolution: Solving issues on first contact increases loyalty by 30%
- Proactive Communication: Order status updates and delivery notifications reduce anxiety
- Hassle-Free Returns: Clear return policies increase purchase confidence
- Personalized Support: Treating VIP customers with dedicated support extends their lifespan by 40%+
Implementation:
- Live Chat for Real-Time Support: Reduces friction and increases purchase confidence. Customers with positive chat interactions have 20% higher CLV.
- Proactive Outreach: Don’t wait for complaints. Reach out:
- After significant purchases to ensure satisfaction
- Before common pain points (e.g., shipping delays)
- To at-risk customers with win-back offers
- VIP Tier Support: Create separate support channels for high-CLV customers. Dedicated account managers for your top 5% of customers can add 15-25% to their lifetime value.
Lever 4: Targeted Retention Marketing (CLV Impact: +30%)
This lever directly addresses customer lifespan through strategic re-engagement and churn prevention.
Win-Back Campaigns for Inactive Customers:
Most ecommerce businesses have 40-60% inactive customers—people who haven’t purchased in 6+ months. These represent a massive CLV opportunity.
Effective Win-Back Strategy:
- Send trigger-based email 3 months after last purchase: “We miss you—here’s 15% off.”
- At 6 months: “Come back for exclusive items you’ll love” (personalized recommendations)
- At 9 months: “Final offer—20% off your next order”
- At 12 months: De-list from email unless they engage
Expected Results: Win-back campaigns achieve 15-25% reactivation rates, extending average customer lifespan by 6-12 months for each reactivated customer.
Churn Prediction and Prevention:
Using basic machine learning, you can identify at-risk customers before they churn:
At-Risk Signals:
- Declining purchase frequency
- Decreasing average order value
- Lower email engagement
- Reduced product category diversity
- Increased time between purchases vs. their historical pattern
Proactive Intervention:
- Personalized “We want to help” support outreach
- “You might love this new product,” personalized recommendations
- Exclusive loyalty offer (“Add $100 to your rewards”)
- Special discount for their preferred category
Lifetime Value Extension: Preventing even 10% of churn extends average customer lifespan from 3 years to 3.3 years—an 11% improvement that directly multiplies CLV.
2026 Trends: AI-Powered CLV and Real-Time Optimization
The CLV measurement and optimization landscape is being transformed by artificial intelligence and machine learning. Understanding these trends is critical for staying competitive.
Trend 1: Predictive CLV with Machine Learning
Traditional CLV calculations rely on historical averages. Predictive models analyze hundreds of behavioral signals to forecast individual customer CLV with 90%+ accuracy.
Signals Analyzed:
- Recency, Frequency, and Monetary (RFM) metrics
- Email engagement patterns
- Website behavior (time on site, pages viewed, bounce rate)
- Product affinity (which categories does this customer prefer?)
- Price sensitivity (discount responsiveness)
- Social signals and referral behavior
- Device type and location patterns
Business Impact: With predictive CLV, you can:
- Personalize acquisition: Spend more on channels that attract high-CLV customer profiles
- Dynamic pricing: Adjust pricing and offers based on predicted CLV
- Customer service allocation: Prioritize support for high-CLV customers
- Product development: Build features for customers with high CLV demand
Implementation: Salesforce Einstein, HubSpot Predictive Lead Scoring, and platforms like Klavena offer predictive CLV as standard features.
Trend 2: Real-Time Adaptive CLV Models
Rather than recalculating CLV monthly, forward-thinking companies update CLV in real-time as customer behavior changes.
Advantages:
- Marketing campaigns adjust automatically to changing customer value
- Churn signals trigger immediate intervention
- Seasonality and market changes update dynamically
- Opportunity for real-time personalization at scale
Example Workflow:
- Customer browses product (triggering engagement signal)
- System updates its CLV prediction upward
- Marketing automation adjusts its eligibility for the premium loyalty tier
- Customer receives personalized offer for complementary products in real-time
- Next visit shows them curated recommendations based on updated behavioral profile
Trend 3: Privacy-First CLV Analytics
With third-party cookies disappearing and privacy regulations tightening (GDPR, CCPA, etc.), CLV analysis is shifting to first-party data and consent-based approaches.
Implications:
- Greater reliance on email and customer data platform data
- Cohort analysis replaces individual-level micro-targeting
- Contextual signals (what you’re browsing) replace behavioral tracking
- Brand-loyalty-driven data sharing (customers willing to share data for relevant offers)
Action: Build robust first-party data collection through:
- Email list growth (your most valuable asset)
- Preference centers (let customers choose communication types)
- Transparent data use (show customers how their data benefits them)
Trend 4: Omnichannel CLV Tracking
Customers interact across websites, mobile apps, social channels, and in-store locations. Accurate CLV requires unified tracking across all touchpoints.
Challenge: A customer might browse on Instagram, add to cart on mobile, abandon on desktop, and finally purchase in-store. Traditional attribution struggles with this complexity.
Solution: Customer data platforms (CDPs) like Segment, Tealium, and mParticle create unified customer profiles across channels, ensuring accurate CLV calculation regardless of where the purchase occurs.
The Implementation Roadmap: From Theory to Action
Understanding CLV is valuable. Implementing it is transformative. Here’s a phased approach:
Phase 1: Foundation (Week 1-2)
- Calculate current CLV using the simple formula for your overall customer base.
- Segment CLV by: acquisition channel, customer cohort, product category
- Compare CLV to CAC for each segment—identify where ratios are healthy vs. concerning
- Select your biggest opportunity (likely: lowest-CLV segment with highest CAC)
Phase 2: Deep Analysis (Week 3-4)
- Investigate the lowest-CLV segment: Why is CLV low? (low purchase frequency?Short lifespan? low AOV?)
- Analyze competitor strategies for similar customer segments
- Test CLV impact of one retention lever (start with email win-back campaign)
Phase 3: Strategic Intervention (Month 2-3)
- Implement the most promising CLV optimization strategy (loyalty program, personalization platform, or service improvements)
- Measure impact weekly: improved retention rate? Higher AOV? Increased repurchase frequency?
- Iterate and refine based on data
Phase 4: Scaling (Month 4+)
- Expand winning strategy across all customer segments
- Move to profit-based CLV calculations, incorporating full cost accounting
- Explore predictive CLV modeling with your historical data
- Establish quarterly CLV reviews as standard business cadence
CLV Calculation Tools and Platforms
You don’t need to calculate CLV manually in spreadsheets. Modern tools automate the process:
E-commerce-Specific:
- Klaviyo: Email marketing + CLV analytics, built-in segmentation
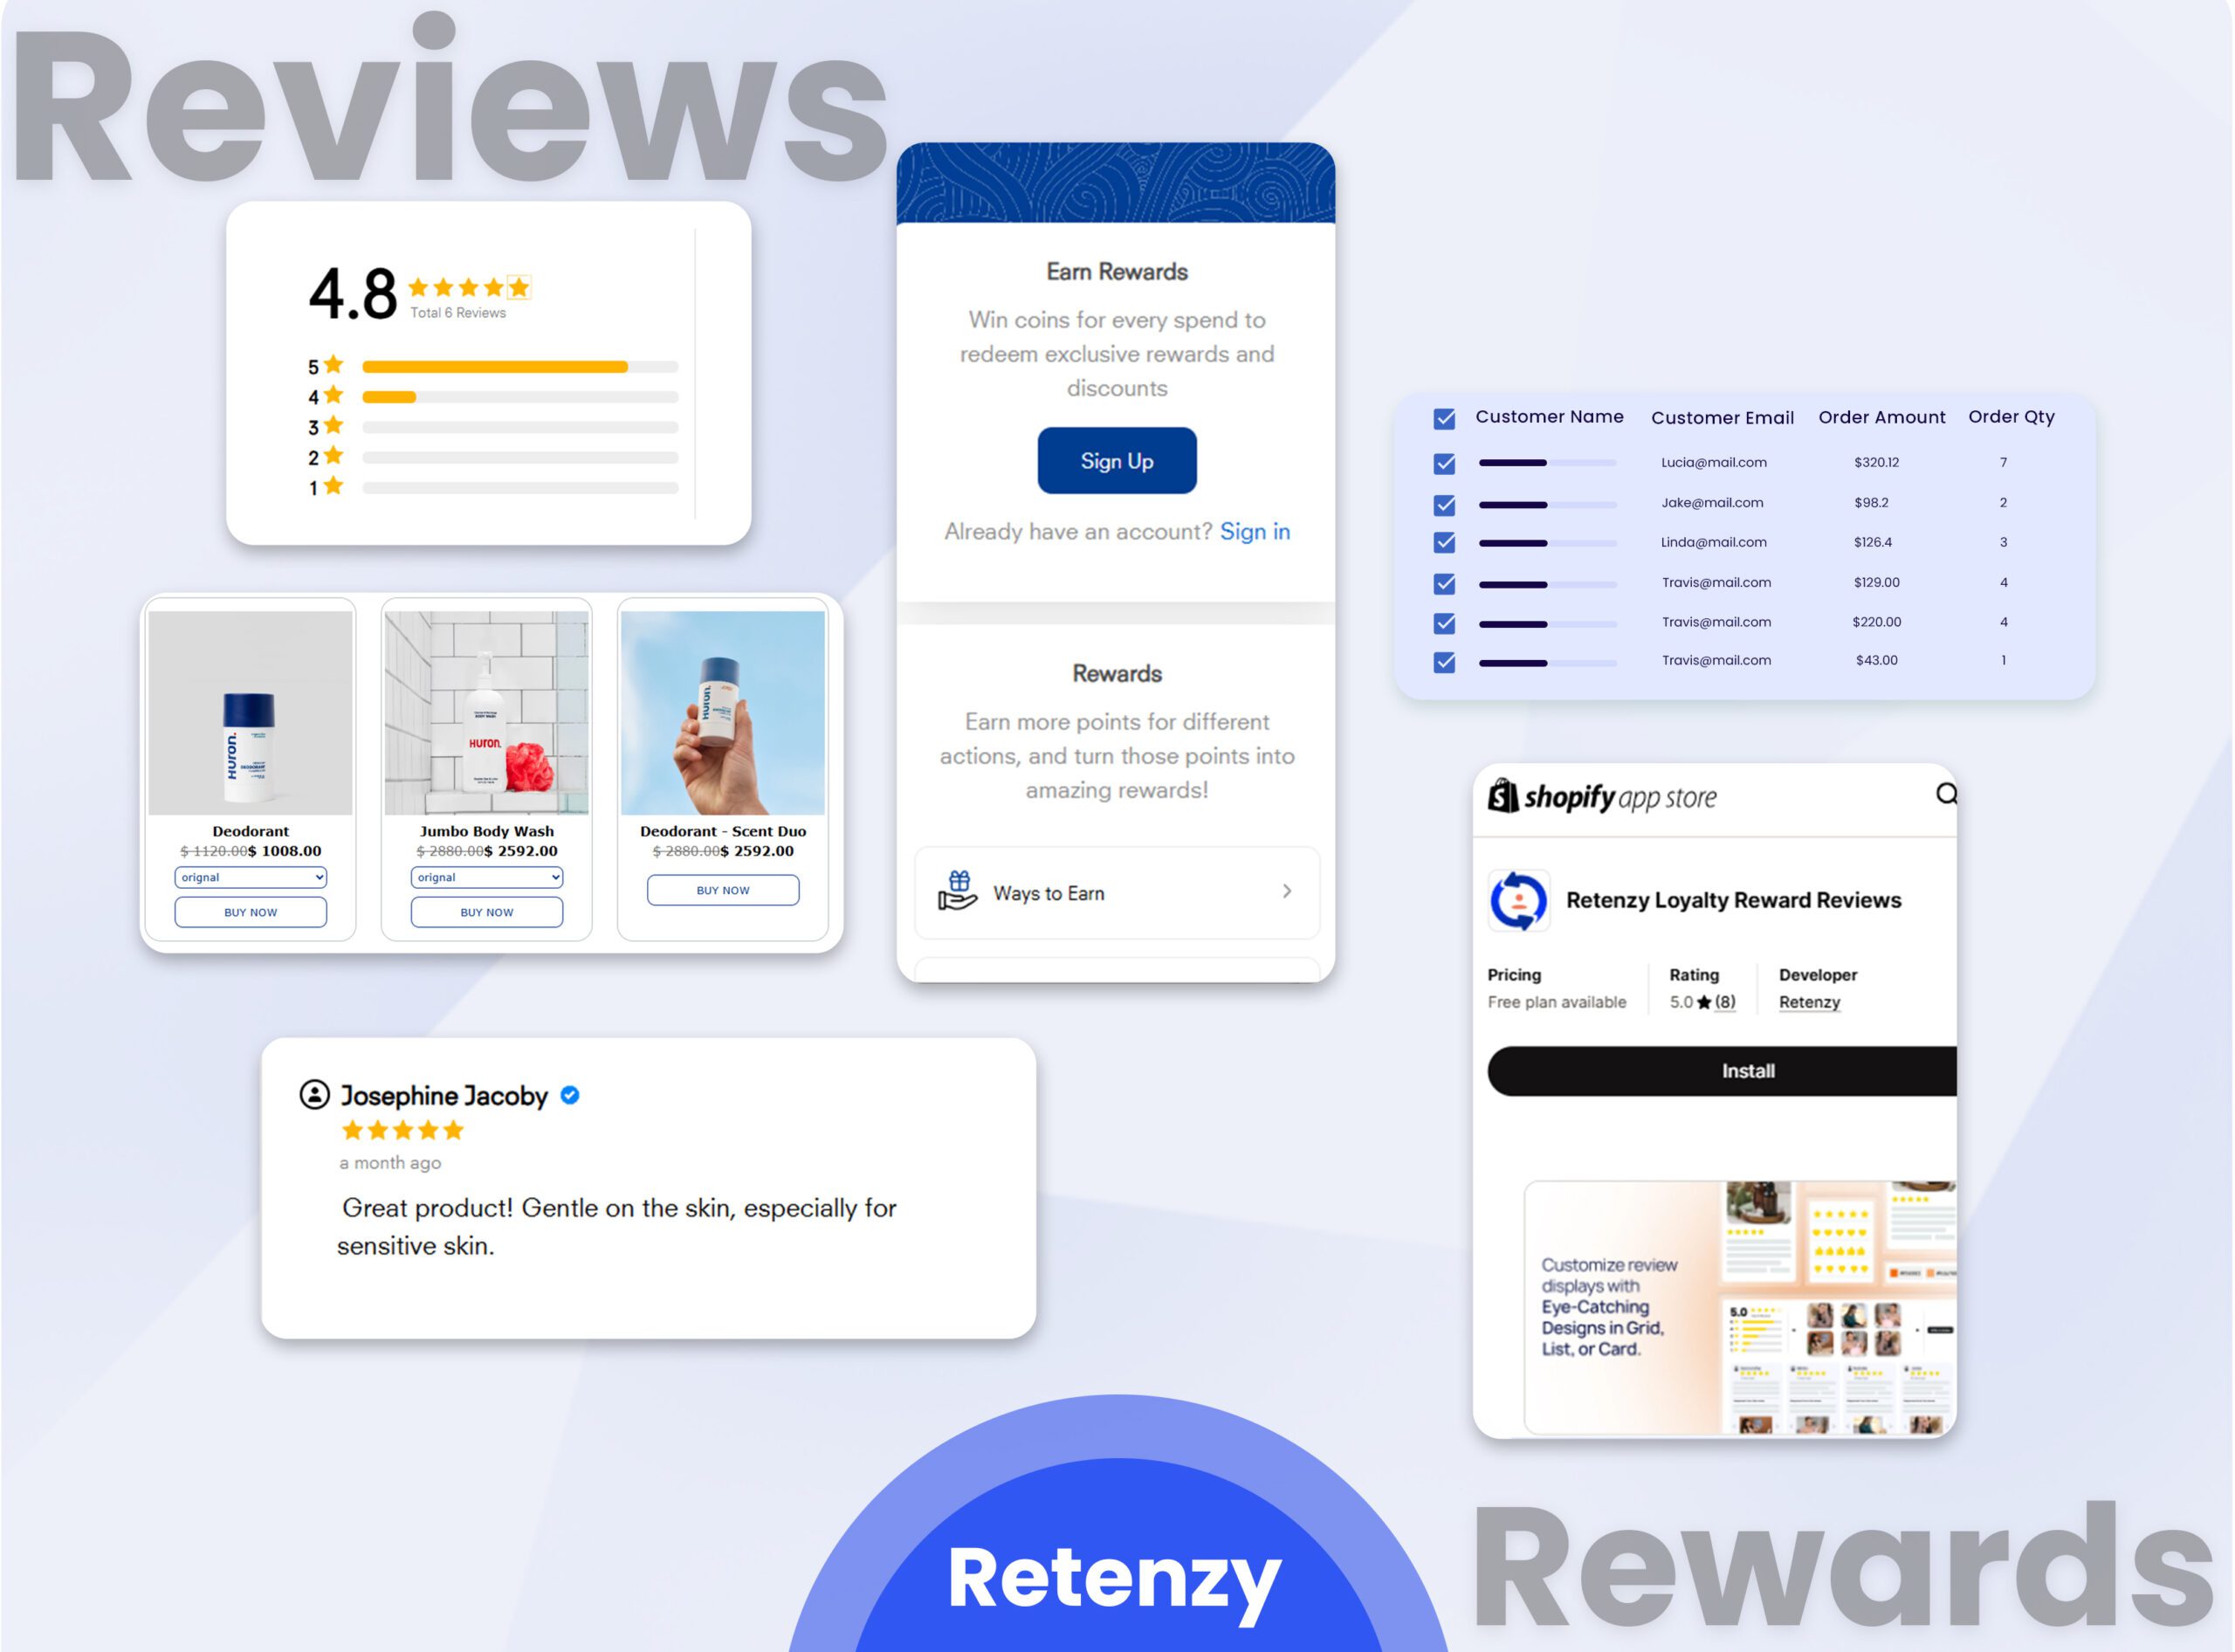
- Yotpo: Reviews, loyalty, and CLV optimization
- Retenzy: Loyalty programs specifically designed for Shopify
- LoyaltyLion: White-label loyalty for ecommerce
Enterprise Platforms:
- Salesforce: Comprehensive CLV modeling within Einstein
- HubSpot: CLV calculation with lifecycle stage tracking
- Segment/Tealium: Customer data platforms that calculate CLV across channels
Analytics & BI Tools:
- Google Analytics 4: Basic CLV calculations with e-commerce setup
- Mixpanel: Cohort analysis and lifetime value metrics
- Amplitude: Advanced retention and CLV analytics
Addressing the Challenges: Real Talk About CLV Implementation
CLV is powerful, but implementation isn’t frictionless. Here are common challenges and solutions:
Challenge 1: Data Quality Issues
Problem: Duplicate customer records, inconsistent tracking, and missing revenue data.
Solution:
- Implement unique customer identifiers across systems.
- Regular data audits and cleansing
- Use customer data platforms to unify data
- Track UTM parameters consistently
Challenge 2: Customer Lifespan Estimation
Problem: How do you estimate the lifespan for a new business with limited data?
Solution:
- Use industry benchmarks while you gather data
- Start with 2-year estimates, refine quarterly
- Segment by cohort (customers acquired in month 1, month 2, etc.) to track actual lifespan
- Use churn rate formula: Lifespan = 1 ÷ Churn Rate
Challenge 3: Attribution Across Channels
Problem: Customer touches 5 different channels before purchasing. Which one gets credit?
Solution:
- Adopt multi-touch attribution models
- Use platforms with built-in attribution (Klaviyo, HubSpot)
- At a minimum, segment CLV by first/last/primary channel
- Recognize that most customers have multi-channel journeys
Challenge 4: Seasonal Distortions
Problem: November and December skew annual averages dramatically.
Solution:
- Calculate separate CLV for seasonal and non-seasonal periods
- Use rolling 12-month averages
- Analyze cohorts by acquisition month separately
- Adjust benchmarks for seasonality
From Metrics to Mindset: Why CLV Culture Matters
Measuring CLV is important. Embedding CLV thinking into your entire organization is transformative.
Companies that develop a “CLV-first” culture:
- Marketing asks, “Will this customer have high CLV?” before investing in acquisition
- Product teams design features based on what high-CLV customers request
- Customer service prioritizes high-CLV customers appropriately
- Finance allocates budgets based on CLV-to-CAC ratios rather than pure revenue
- Email and retention teams have equal prominence to acquisition teams
Organizational Benefits:
- Reduced wasted marketing spend (stop acquiring low-CLV customers)
- Improved customer satisfaction (focus on relationships, not transactions)
- Higher profitability (extend lifespan, increase frequency, boost AOV)
- Sustainable growth (repeatable, customer-centric model)
- Competitive resilience (harder to disrupt relationship-based advantage)
Conclusion: CLV as Your North Star Metric
As we move into 2026 and beyond, the businesses that win aren’t those that acquire the most customers. They’re those that build the strongest, most profitable customer relationships.
Customer Lifetime Value isn’t just a metric to calculate—it’s a philosophy to embrace.
By understanding how to measure CLV, analyzing the factors that drive it, and implementing proven optimization strategies, you fundamentally shift your business from short-term transaction orientation to long-term relationship focus. This shift underlies every sustainable high-growth company.
The path is clear:
- Calculate your current CLV using the formulas in this guide
- Segment CLV by acquisition channel and customer cohort
- Identify your biggest opportunities (lowest CLV segments with the highest CAC)
- Test one optimization lever from our strategic framework
- Measure impact rigorously
- Scale what works
The competitive advantage of CLV mastery compounds over time. The company that improves CLV by 10% this year, 15% next year, and 12% the year after doesn’t just beat competitors—it dominates.
Your customers are your business. CLV is how you measure their true worth.
Have questions about CLV for your specific business? The comments section below is open. Share your context, and let’s discuss how these frameworks apply to your situation.
Last Updated: December 2025
This guide is continuously updated with the latest CLV research, tools, and strategies. Subscribe to stay current.