11 Shopify Apps for Advanced Analytics & Reporting in 2026
In today’s data-driven ecommerce landscape, advanced analytics aren’t optional—they’re essential for growth. While Shopify’s native analytics provide a foundation, they fall short when merchants need deeper insights into customer behavior, profit margins, and marketing ROI.
The difference between thriving stores and struggling ones comes down to data intelligence. Advanced analytics apps unlock patterns and opportunities that native reporting misses. As we move into 2026, merchants increasingly demand AI-powered insights, real-time monitoring, omnichannel reporting, and predictive analytics.
This guide explores 10 of the best Shopify apps for advanced analytics in 2026, featuring real-time dashboards, AI recommendations, cohort analysis, LTV tracking, and seamless marketing integrations.
Key Takeaways
Profit Over Revenue: In 2026, “vanity metrics” like gross revenue are secondary. Top-tier apps now prioritize Net Profit, automatically factoring in COGS, shipping, ad spend, and transaction fees.
AI is the New Standard: Advanced reporting has moved from static charts to AI-powered anomaly detection and natural language recommendations that tell you why a metric changed and how to fix it.
Retention is the Growth Engine: With rising acquisition costs, apps focusing on LTV (Lifetime Value) and Cohort Analysis (like Lifetimely and Retenzy) are essential for sustainable scaling.
First-Party Data is Critical: As third-party cookies depreciate, the best apps use server-side tracking and first-party data to ensure marketing attribution remains accurate across Meta, Google, and TikTok.
Consolidation Wins: Merchants are moving away from fragmented spreadsheets toward unified BI dashboards (like Polar or Daasity) that sync Shopify data with Amazon, retail POS, and wholesale channels.
The Evolution of Shopify Analytics in 2026
1. AI-Powered Insights and Automation
Pointer: Global AI market growing at 35.9% CAGR (2025-2030).
AI automatically surfaces anomalies, forecasts trends, and provides natural language insights—transforming complex data into simple recommendations without manual analysis.
2. Omnichannel Data Consolidation
Pointer: 61% of Shopify merchants sell across multiple channels (Meta, Google, TikTok, Amazon).
Advanced analytics consolidate data from all channels, eliminating silos and providing a 360-degree view of store performance.
3. Real-Time Monitoring and Dashboards
Pointer: Static reports are obsolete; live dashboards updating minute-by-minute are essential.
Real-time analytics enable rapid response to market changes, flash sales, and traffic spikes—shifting from reactive to proactive decision-making.
4. Predictive Analytics and Demand Forecasting
Pointer: Historical data powers predictions for customer churn, inventory needs, and seasonal demand.
Predictive models help optimize inventory, prevent stockouts, and enable proactive business decisions rather than reactive responses.
5. Privacy-First and First-Party Data
Pointer: Third-party cookies are depreciating; first-party data is the future.
Modern platforms prioritize first-party data collection and server-side tracking to ensure accurate attribution while respecting privacy and compliance regulations.
6. Profit-Centric Reporting
Pointer: Track COGS, shipping, marketing spend, payment fees, and app subscriptions—not just revenue.
Comprehensive profit tracking reveals which products, channels, and campaigns are truly profitable, identifying hidden margin erosion that revenue metrics miss.
The 11 Best Shopify Apps for Advanced Analytics & Reporting in 2026
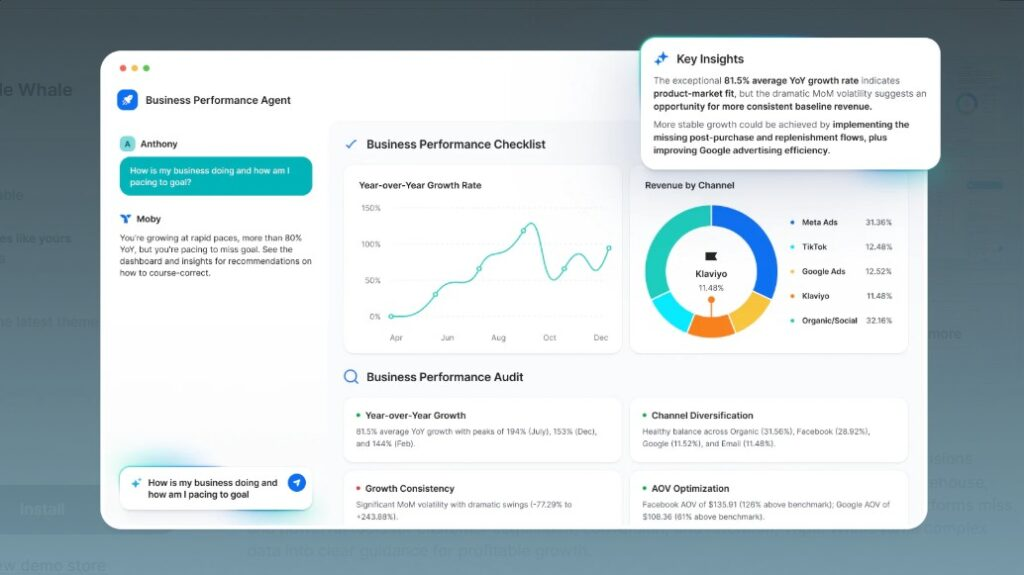
1. Triple Whale Analytics: Real-Time Profit Dashboard for DTC Brands
Best For: Direct-to-consumer (DTC) brands needing real-time performance tracking and comprehensive ad attribution
Triple Whale has emerged as the go-to platform for fast-growing DTC brands that live by data. Built specifically for ecommerce merchants selling direct to consumers, Triple Whale centralizes your entire business performance into a single, sleek dashboard that feels like mission control for your store.
Key Features:
Real-Time Profit Dashboard: Monitor your true profit (after all costs), updating live with every order
Cohort and LTV Analysis: Segment customers by acquisition date and lifetime value to identify your most valuable segments
Ad Performance Integration: Seamlessly pulls ad spend data from Meta (Facebook/Instagram), TikTok, Google Ads, and other platforms
Inventory Analytics: Track inventory levels against sales velocity to optimize stock management
Customer Journey Tracking: Visualize the complete path customers take from first click to repeat purchase
Mobile-First Dashboard: Monitor performance on-the-go with a fully optimized mobile interface
Predictive Analytics: AI-powered forecasts for revenue, churn, and seasonal trends
Advanced Features:
Triple Whale goes beyond basic reporting with sophisticated features like cash flow forecasting, lifetime customer value predictions, and marketing channel profitability analysis. The app automatically calculates your CAC (Customer Acquisition Cost) against LTV to determine sustainable marketing spend levels.
Pros:
Exceptional Real-Time Updates: Data refreshes continuously, not hourly or daily—perfect for monitoring flash sales or marketing campaigns
Simplifies Complex Analytics: Transforms overwhelming data into clear, action-oriented metrics
Ideal for Shopify + Paid Media Mix: If you’re running Meta, TikTok, or Google Ads, this app shines by showing true ROI
Reduces Ad Spend Waste: By pinpointing which campaigns actually generate profit (not just revenue), you can reallocate budget to winners
Multi-Store Capability: Manage multiple DTC brands from a unified dashboard
Integrates with Popular Tools: Works with Klavio, Gorgias, Subbly, and other key platforms
Cons:
May Be Overly Feature-Rich for Early-Stage Stores: If you’re just launching, the depth of features might feel overwhelming
Pricing Can Be Steep for Smaller Merchants: At $149+/month, it’s an investment best suited to stores with $50k+ monthly revenue
Requires Marketing Data Integration: Maximum value comes from connecting all ad accounts; manual entry doesn’t work well
Learning Curve: The comprehensive feature set takes time to master
Pricing:
Starts at $149/month for core features
Custom enterprise pricing available for multi-store or high-volume operations
Free trial available; 14-day money-back guarantee
When to Choose Triple Whale: If you’re a DTC brand spending significant money on paid advertising and need to prove that your marketing campaigns drive actual profit—not just revenue—Triple Whale is worth the investment.
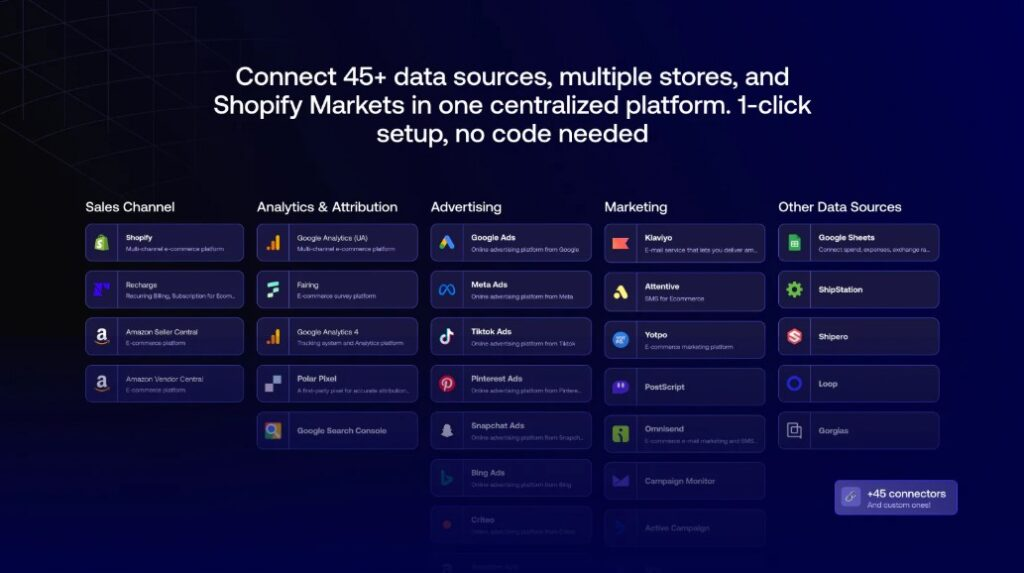
2. Polar Analytics: Unified BI Dashboard for Multi-Channel Ecommerce Operators
Best For: All-in-one business intelligence for multi-channel operators managing complex data consolidation
Polar Analytics takes a different approach to e-commerce reporting by acting as a true business intelligence platform. Rather than trying to do everything inside Shopify, Polar connects your store to a comprehensive BI dashboard that pulls data from Shopify, email platforms, social media, Google Analytics, and payment processors into one unified view.
Key Features:
KPI Dashboards Across Acquisition, Retention, and Finance: Pre-built dashboards covering customer acquisition metrics (ROAS, CAC), retention metrics (repeat purchase rate, LTV), and financial metrics (gross profit, net profit)
Multi-Source Data Consolidation: Automatically syncs data from Shopify, Klaviyo, Meta, Google Ads, Shopify Payments, and 20+ other platforms
Predictive Analytics and Automated Insights: AI-powered recommendations surface growth opportunities and flag concerning trends
Cohort-Based Analysis: Segment customers by signup date, purchase behavior, or demographics to track retention curves
Interactive Dashboards: Custom-build dashboards or use pre-built templates; filter data by any dimension (product, customer segment, channel, etc.)
Revenue Cohorts: Track how different customer cohorts contribute to recurring revenue over time
Acquisition Funnel Analysis: Visualize the customer journey from first touchpoint to repeat purchase
Mobile-Optimized Dashboards: View critical metrics from any device
Advanced Features:
Polar Analytics includes predictive modeling that forecasts which customer segments will churn, demand forecasting for inventory optimization, and channel attribution that accounts for multi-touch customer journeys—not just last-click attribution.
Pros:
Built for Non-Technical Teams: Intuitive UI requires no coding or technical knowledge; anyone on your team can use it
Quick Onboarding and Clean UI: Set up connections within minutes; dashboards are visually clean and digestible
Supports Multi-Store Data Consolidation: Manage data across multiple Shopify stores and marketplaces from a single interface
Comprehensive Integration Ecosystem: Connects with virtually every marketing and e-commerce tool you use
Cohort Tracking Depth: Superior to most competitors for tracking customer cohorts and retention trends
Real-Time Data: Dashboard updates automatically as new data arrives
Cost-Effective for Agencies: Great for agencies managing multiple client accounts
Cons:
Limited Customization Compared to Enterprise BI Tools: If you need highly bespoke reports, enterprise BI tools like Daasity may be better
No Free Plan: Plans start with a free trial but require a paid subscription
Interface Complexity for Beginners: While clean, the depth of features can feel overwhelming initially
Data Latency: Some integrations can have 6-24 hour delays, not true real-time
Pricing:
Free trial available (7-14 days)
Paid plans start around $300-500/month, depending on data volume and feature.s
Custom enterprise pricing for agencies and large operations
When to Choose Polar Analytics: Choose Polar if you’re managing multiple sales channels, working with agencies, or need sophisticated cohort analysis and retention tracking alongside financial metrics.
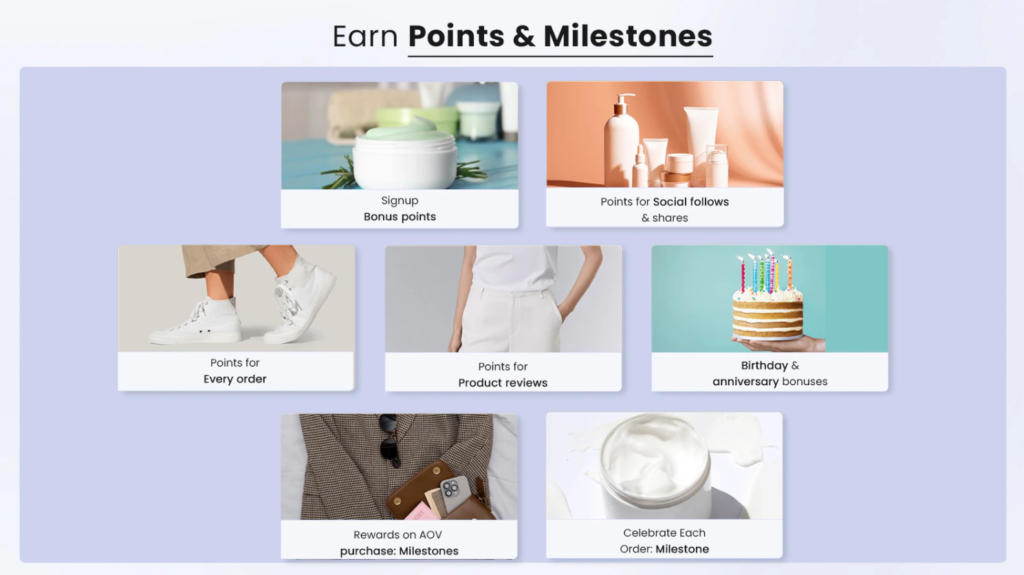
3. Retenzy: Loyalty & Rewards Analytics That Drive Measured Growth
Best For: Merchants serious about building customer loyalty programs and measuring every dollar earned through rewards, coupons, and customer feedback
Retenzy answers the question loyalty-focused merchants need answered: “How much revenue do my rewards programs actually generate, and how do they impact customer lifetime value?” While most analytics apps focus on transaction data, Retenzy transforms customer rewards from a cost center into a measurable growth driver with clear ROI attribution.
Key Features:
Reward Analytics Dashboard:
Revenue Generated from Rewards: See exactly how much revenue your loyalty program generates and what percentage of total store revenue this represents
Reward Issued vs. Redeemed Tracking: Monitor rewards earned versus actually redeemed, revealing real purchase behavior vs. just accumulated points
Redemption Pattern Analysis: Identify which types of rewards drive actual purchases versus those that just pile up unused
Campaign ROI Analysis: Discover which loyalty campaigns provided the largest return on investment
Order Volume Impact: Compare historical order volume generated through reward campaigns with charts
Customer Journey Visualization: See exactly where rewards drive incremental purchases
AOV Growth Strategy:
Average Order Value Tracking by Coupon/Campaign: Track the AOV impact of each coupon, discount, or loyalty point used
Basket Volume Analysis: See how reward strategies increased overall customer spending
Code and Campaign Comparison: Compare AOV across different reward codes to leverage upsell opportunities
Price Strategy Optimization: Use AOV insights to inform pricing and bundling strategies
Coupon Performance & Review Analytics:
Coupon Utilization Tracking: Total coupons created vs. used; identify underperforming discounts
Customer Sentiment Analysis: Comprehensive view of customer sentiment through charts, graphs, and heat maps
Rating Breakdown Analytics: View star rating averages with actionable insights (5-star, 4-star, below 4-star tiers)
Top Reviewed & Rated Products: Discover products that have won customers’ hearts for marketing emphasis
Reviews by Source: Identify which channels (email, product page, loyalty programs) are most effective for collecting reviews
Advanced Features:
Retenzy’s Reward Status Dashboard tracks earned versus redeemed rewards, revealing which customer segments actually engage with your program. Visual Dashboards & Reports display all insights as graphs, charts, and pictographs—perfect for presenting ROI to stakeholders.
Pros:
Loyalty Program ROI Clarity: Transforms reward programs into measurable profit drivers with clear attribution
Revenue Attribution: See exactly how much revenue comes from loyalty vs. non-loyalty customers
Redemption Rate Optimization: Identify reward types that actually drive purchases
Multi-Metric Dashboard: Combines revenue, orders, AOV, coupon performance, and customer feedback in one platform
Visual Communication: Charts and graphs make complex metrics understandable for team presentations
Customer Sentiment Integration: Review analytics reveal what customers think about your products
Trust-Building Capabilities: Top-rated products with review counts boost conversions through social proof
Easy Free Trial: Start measuring loyalty impact immediately with no credit card required
Cons:
Loyalty Program Required: Maximum value requires an active loyalty program (though Retenzy helps you launch)
Learning Curve: Feature depth requires time investment to master
Setup Time: Connecting data sources and configuring tracking takes 2-4 weeks
Data Accumulation: Best insights require 3-6 months of historical loyalty data
Pricing scales with store size and number of rewards tracked
Custom enterprise pricing for multi-store operations
When to Choose Retenzy: Choose Retenzy if you’re running a customer loyalty program and need to prove its ROI, if you want to understand which rewards drive actual purchases versus just accumulating, or if you need to communicate loyalty program impact to stakeholders.
Strategic Advantage in 2026: As retention becomes the primary growth driver for mature ecommerce brands, Retenzy positions merchants to win by proving that investment in loyalty pays measurable dividends. Merchants using Retenzy can confidently expand loyalty programs, knowing exactly which rewards work and how much revenue they generate.
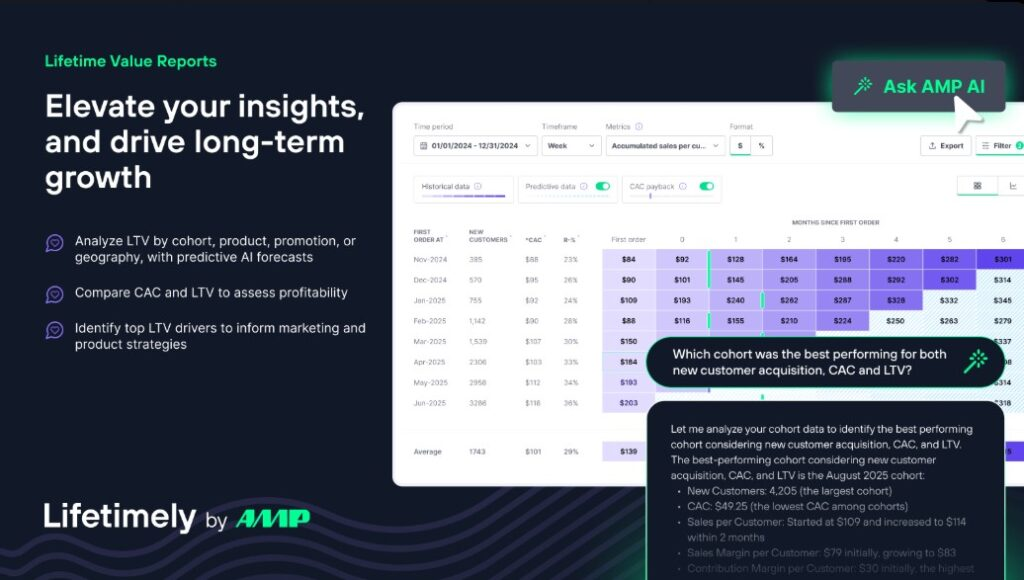
4. Lifetimely: Customer Lifetime Value and Retention Analysis Engine
Best For: Merchants obsessed with profitability, customer retention strategies, and long-term business growth
Lifetimely serves a specific but critical purpose: helping merchants understand which customers are actually profitable over their lifetime, not just on their first purchase. This app is ideal if customer retention, repeat purchases, and loyalty programs are central to your growth strategy.
Key Features:
LTV by Cohort and Product: Calculate which products generate the most repeat purchases and which customer segments are most valuable long-term
CAC vs. LTV Tracking: Monitor your Customer Acquisition Cost against Lifetime Value to ensure sustainable unit economics
Retention Rate Visualization: Track repeat purchase percentages over time periods (30, 60, 90, 180 days) to identify retention trends
Profit Breakdown by Channel: See which acquisition channels deliver the most profitable customers (not just the cheapest)
Customer Segmentation by Value: Automatically group customers by lifetime value tiers to identify VIPs vs. occasional buyers
Churn Prediction: Identify at-risk customers before they disappear
Cohort Retention Curves: Visualize how different customer cohorts retain over time
Repeat Purchase Analysis: Track the percentage of customers making 2nd, 3rd, 4th, and subsequent purchases
Advanced Features:
Lifetimely provides sophisticated customer value metrics like payback period (how long it takes a customer to generate positive ROI), customer concentration risk (reliance on top customers), and product-level profitability, factoring in repeat purchase rates.
Pros:
Easy to Digest Reports on Complex Metrics: Transforms complicated retention and profitability calculations into simple visualizations
Strong Post-Purchase Analysis: Reveals which products and customers generate long-term value
Essential for Long-Term Growth Planning: Helps you focus acquisition spend on high-value customer sources
Free Version Available: Test the platform with limited features before upgrading
Perfect for Loyalty Program Integration: Works beautifully alongside loyalty apps like Retenzy to track program impact
Reduces CAC-to-LTV Ratio: Helps identify acquisition channels with the best unit economics
Cons:
Focuses More on Retention; Lacks Full Store Overview: Not ideal if you need comprehensive sales and operational metrics
Limited Integrations Outside Marketing Platforms: Works well with email and ads, but has fewer integrations than all-in-one platforms
Requires Historical Data: Needs time to accumulate customer purchase history for reliable predictions
Limited Inventory Tracking: Doesn’t provide deep inventory analytics if you need that
Pricing:
Free version with limited features (basic LTV and retention metrics)
Paid plans start at $149/month for advanced cohort analysis and predictions
Custom pricing for multi-store accounts
When to Choose Lifetimely: Choose Lifetimely if customer retention, repeat purchases, and sustainable profitability are your primary business goals, or if you’re implementing a customer loyalty program and need to prove its ROI.
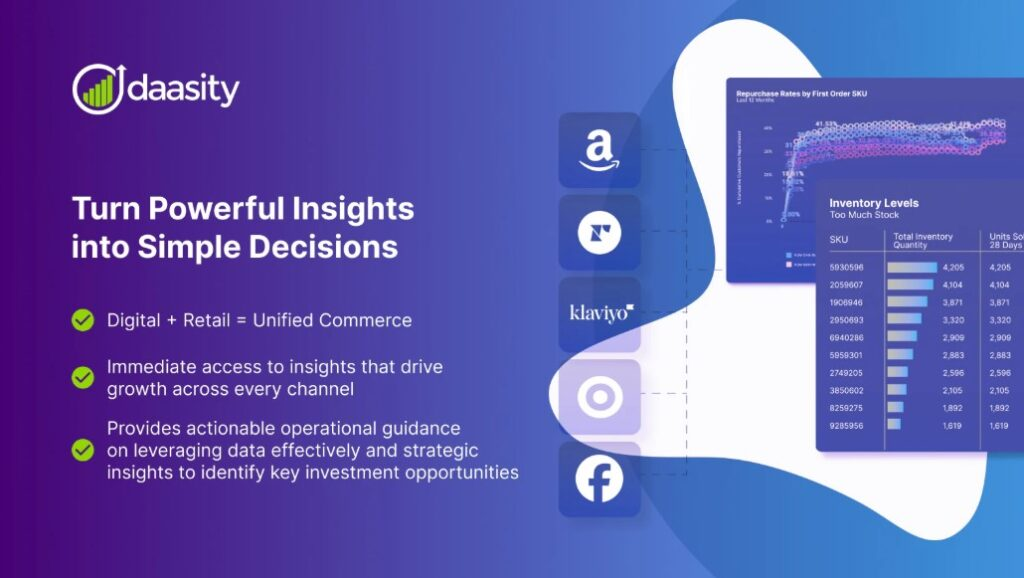
Daasity is a step up in complexity and power—it’s an enterprise data platform designed for large brands that need to consolidate sales data from dozens of sources into a unified analytics ecosystem. If you’re managing Shopify, Amazon, retail POS systems, and third-party marketplaces simultaneously, Daasity creates the infrastructure to connect them all.
Key Features:
Unified Data Across DTC, Retail, and Wholesale: Consolidates Shopify store data with Amazon, retail POS, wholesale, and B2B sales into one warehouse
Advanced ETL (Extract, Transform, Load) for Multiple Data Sources: Connects not just Shopify but non-Shopify sources, custom databases, and proprietary systems
SQL Query Builder and Data Warehouse Access: Direct access to your data warehouse for custom analysis; write SQL queries for unlimited reporting possibilities
Deep Marketing Attribution Modeling: Multi-touch attribution that properly credits each touchpoint in the customer journey
Custom Dashboards and BI Tools Integration: Works with Tableau, Looker, Power BI, or custom dashboards
Inventory Management Across Channels: Track inventory levels, allocations, and transfers across all sales channels
Real-Time Data Syncing: As close to real-time as enterprise infrastructure allows
Data Governance and Quality Controls: Ensures data consistency and accuracy across all sources
Advanced Features:
Daasity includes advanced features like cohort analysis, RFM segmentation, revenue forecasting, and predictive analytics. It can combine data from your ERP system with Shopify data to provide complete financial visibility.
Pros:
Enterprise-Grade Reporting: Scalable infrastructure built for high-volume transactions and complex business models
Highly Customizable Dashboards: Because you have direct database access, reporting possibilities are nearly unlimited
Excellent for Brands Scaling Across Multiple Channels: Perfect for DTC brands expanding into retail, wholesale, or Amazon
Reduces Data Silos: All business data in one place enables data-driven decisions across departments
Integrates with Enterprise Tools: Works with enterprise CRMs, ERPs, accounting software, and BI platforms
Data Governance: Ensures compliance, data quality, and security across all sources
Cons:
Requires Technical Setup or Analyst Support: Not a plug-and-play solution; you’ll likely need technical expertise or hire consultants
Premium Pricing: Enterprise-only focus means significant investment
Steeper Learning Curve: Complex platform requires training and ongoing support
Overkill for Small Stores: If you have just one Shopify store, this is unnecessary complexity
Pricing:
Custom pricing only; enterprise focus means no published pricing
Typically $5,000-$50,000+ per month, depending on data volume and complexity
Includes implementation support and ongoing account management
When to Choose Daasity: Choose Daasity if you’re a large brand with $10M+ annual revenue, managing multiple sales channels or complex data infrastructure requirements.
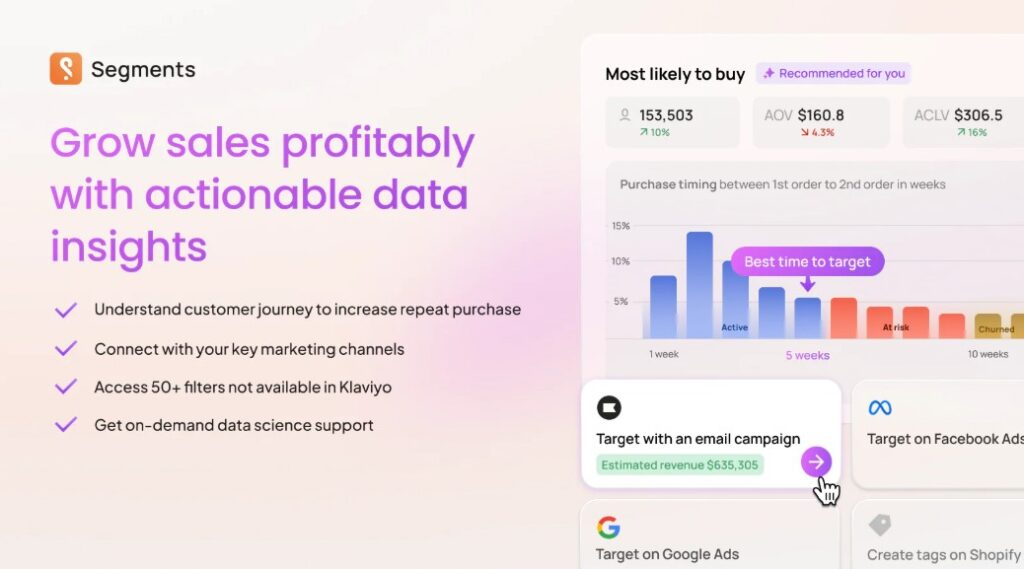
6. Segments Analytics: Predictive Customer Segmentation for Retention Marketing
Best For: Retention-focused merchants using email and SMS marketing to drive repeat purchases
Segments Analytics takes customer segmentation and retention marketing to another level. It’s specifically designed to help merchants run targeted retention campaigns by automatically grouping customers based on behavioral patterns and predicting which will churn.
Key Features:
RFM Segmentation Automation: Automatically groups customers into segments based on Recency, Frequency, and Monetary value—no manual setup needed
Predictive Churn Modeling: AI identifies which customers are atthe highest risk of never purchasing again
Behavioral and Cohort Analysis: Segment customers by purchasing patterns, product preferences, and engagement level
Dynamic Customer Lists for Email/SMS: Automatically updates email lists based on customer behavior; send campaigns only to relevant segments
Integration with Klaviyo and Meta: Syncs automatically with your email and SMS platform; push targeting lists to Meta for custom audiences
Repeat Customer Identification: Flag your best repeat buyers for VIP treatment.
Customer Lifecycle Tracking: Monitor where each customer sits in the lifecycle (first purchase, loyal repeat, at-risk, churned)
Campaign Performance Analytics: Track which segments respond best to your retention campaigns
Advanced Features:
Segmentsincludes predictive modeling that ranks customers by likelihood to purchase in the next 30 days, seasonal behavior analysis to identify when customers are most likely to buy, and channel propensity modeling to determine whether each customer prefers email, SMS, or push notifications.
Pros:
Perfect for Email and SMS Marketers: Designed specifically for retention marketing; integrates seamlessly with Klaviyo, Klaviyo SMS, and other platforms
Provides Actionable Targeting Data: Creates automatic audience lists you can use for email campaigns immediately
Improves Repeat Customer Rate: By identifying and nurturing at-risk customers, you naturally boost the repeat purchase percentage
Free Plan Available: Try core features without payment
Simple Implementation: Connect your store, and Segments starts analyzing immediately
Cons:
Limited Financial Data Reporting: Doesn’t track profit, COGS, or financial metrics—focused purely on behavior and retention
Less Useful for Stores Not Focused on Retention: If you’re just starting and don’t have repeat customers yet, this app has limited value
Limited Inventory or Operations Metrics: Doesn’t help with supply chain or inventory optimization
Integration Limited to Marketing Platforms: Works great with email/SMS, but limited integration with other tool categories
Pricing:
Free plan available (basic segmentation and small contact list limits)
Pro plan starts at $199/month for advanced features and larger contact limits.
Custom pricing for enterprise customers
When to Choose Segments: Choose Segments if email and SMS marketing are core to your retention strategy, and you want AI-powered customer segmentation to maximize campaign effectiveness.
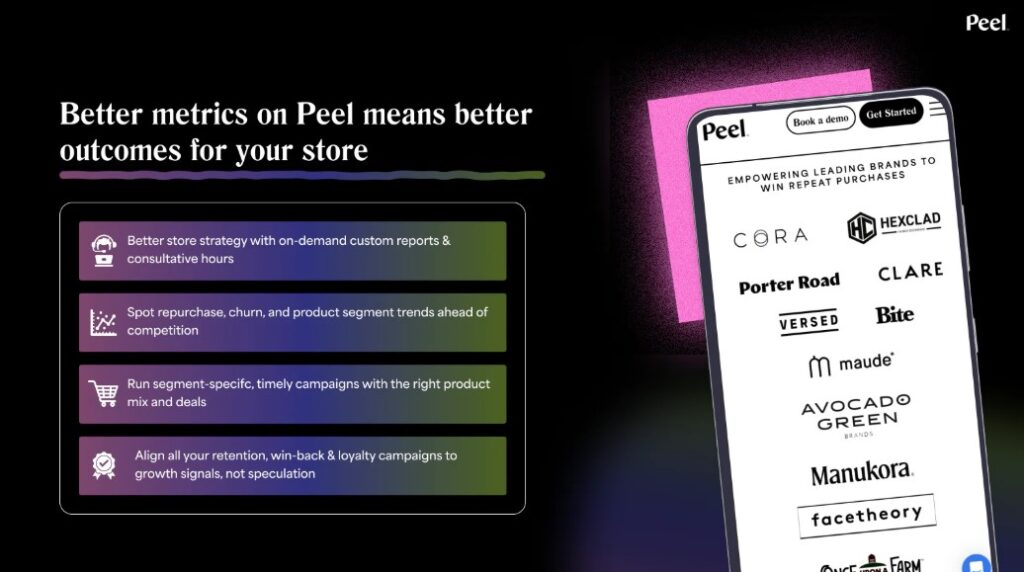
7. Peel Insights: Automated Daily Reports Delivered to Your Inbox or Slack
Best For: Busy store managers and teams wanting automated, actionable performance reports without dashboard checking
Peel Insights solves a specific problem: it delivers curated, actionable insights directly to your inbox or Slack every day. Rather than requiring you to log into a dashboard, Peel automatically analyzes your data and tells you what matters today.
Key Features:
Daily, Weekly, and Monthly Performance Recaps: Automatically generated summaries of key metrics delivered on your schedule
100+ Pre-Built Metrics: Covers sales, orders, customers, products, retention, and more—you choose which to track
Smart Segmentation: Pre-built segments like first-time vs. returning customers, new products vs. bestsellers, high-margin vs. low-margin items
Slack/Email Delivery: Reports arrive in your inbox or Slack channel; no need to remember to check a dashboard
No-Code Setup: Connect your Shopify store and select metrics; Peel handles everything else
Product Performance Insights: See which products drive most revenue, profit, and repeat purchases
Advanced Features:
Peel includes automated alerts for unusual metrics (e.g., “AOV dropped 23% today”), performance comparisons to previous periods, and forecast accuracy checks. You can customize exactly which metrics matter most to your business.
Pros:
Great for Busy Teams: Automated delivery means insights come to you; no need to log in or check dashboards
Saves Time with Automated Delivery: Receives reports without effort; frees up time for strategic decisions instead of data gathering
Highly Focused on Retention and Customer Behavior: Metrics align with what matters for sustainable growth
Affordable and Simple: Straightforward pricing and minimal setup
Integrates with Slack: Reports land in team Slack channels for quick visibility
No-Code Setup: Anyone can implement it without technical knowledge
Cons:
Less Customizable Reporting: Pre-built metric options are somewhat limited; you can’t create highly custom reports
Advanced Data Users May Find It Limited: If you need deep data exploration, this won’t satisfy your needs
Limited Integration Ecosystem: Works mainly with Shopify and Slack; doesn’t integrate deeply with other platforms
Not Real-Time: Reports are scheduled (daily, weekly); not continuous monitoring
Pricing:
Free trial available
Plans start at $49/month for small stores
Premium plans $200+/month for larger operations with more metrics
Annual discounts available
When to Choose Peel: Choose Peel if you want automated insights delivered effortlessly without dashboard management, or if your team prefers Slack-based notifications.
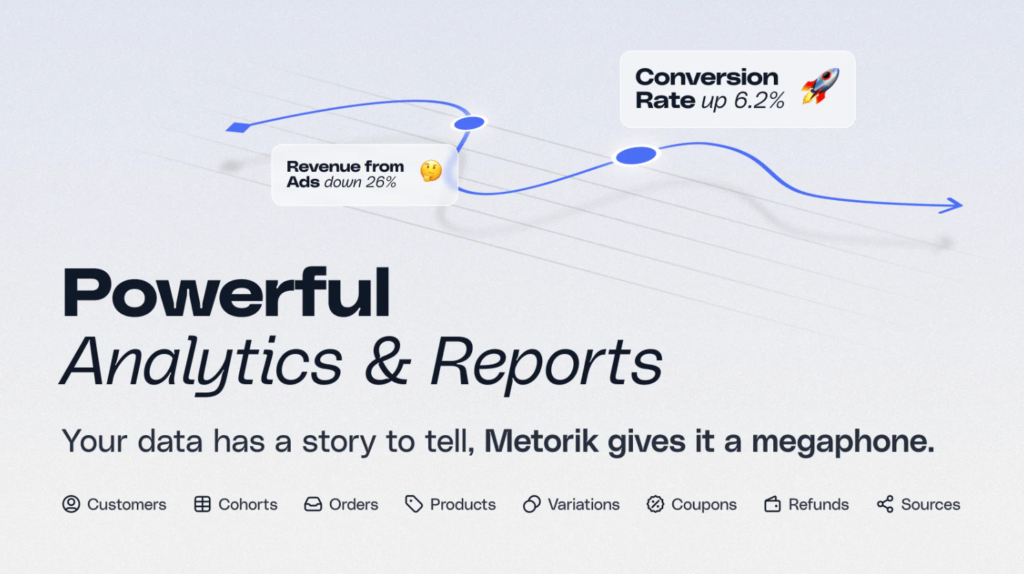
8. Metorik: Comprehensive Real-Time Analytics and Email Automation Integration
Best For: Merchants needing advanced segmentation, detailed customer profiles, and automated abandoned cart recovery
Metorik combines powerful real-time analytics with email automation capabilities, creating a platform that bridges analytics and customer communication. It’s particularly strong for customer behavior analysis and driving repeat purchases through targeted email campaigns.
Key Features:
Real-Time Performance Dashboards: Intuitive dashboards showing live sales, products, and customer behavior data
75+ Advanced Reports: Sales reports, product performance, customer segmentation, subscription analysis, refund trends, and more
Instant Customer Segmentation: Filter customers by any criteria—purchase history, spending, purchase frequency, geographic location, product affinity
Period Comparisons and Forecasting: Compare performance across different time periods and forecast future metrics
Detailed Customer Profiles: View individual customer history, lifetime value, all orders, and purchase patterns
Abandoned Cart Recovery Automation: Automated emails for carts abandoned during checkout
Email Campaign Segmentation: Create highly targeted email campaigns based on customer behavior
Scheduled Data Exports: Automate CSV exports to Google Sheets or email on your schedule
Google Analytics Integration: Combine Shopify data with GA4 data to calculate conversion rates even with basic tracking
Advanced Features:
Metorik includes subscription analysis (tracking churn rates and retention), RFM analysis for customer value segmentation, competitive benchmarking against similar Shopify stores, and detailed product-level profitability analysis.
Pros:
Fast and Smooth Performance: Runs on external servers, so it never impacts your store’s speed
Detailed Reports and Segmentation: Far more granular than Shopify’s native analytics
Beautiful Visualizations: Charts and graphs make data easy to understand
Works for Subscription Stores: Excellent subscription metrics, including churn and retention analysis
Integrates with Google Analytics: Combines data sources for comprehensive view
Excellent Customer Support: Known for responsive, helpful support team
Great for Agencies: Multi-store management and client reporting features
Cons:
Pricing Can Be High for Smaller Stores: Premium features require paid subscription
Learning Curve: Feature depth means time investment to master the platform
Email Automation Limited: Not as powerful as dedicated email platforms like Klaviyo
Requires Data Accumulation: Best insights require 3-6 months of historical data
Pricing:
Free trial available (14-21 days)
Plans start around $100/month for core features
Pro plans $300-600+/month for advanced features and higher order volumes
Enterprise pricing available for agencies
When to Choose Metorik: Choose Metorik if you want comprehensive real-time analytics combined with email automation, particularly for subscription stores or when you need detailed customer profiling.
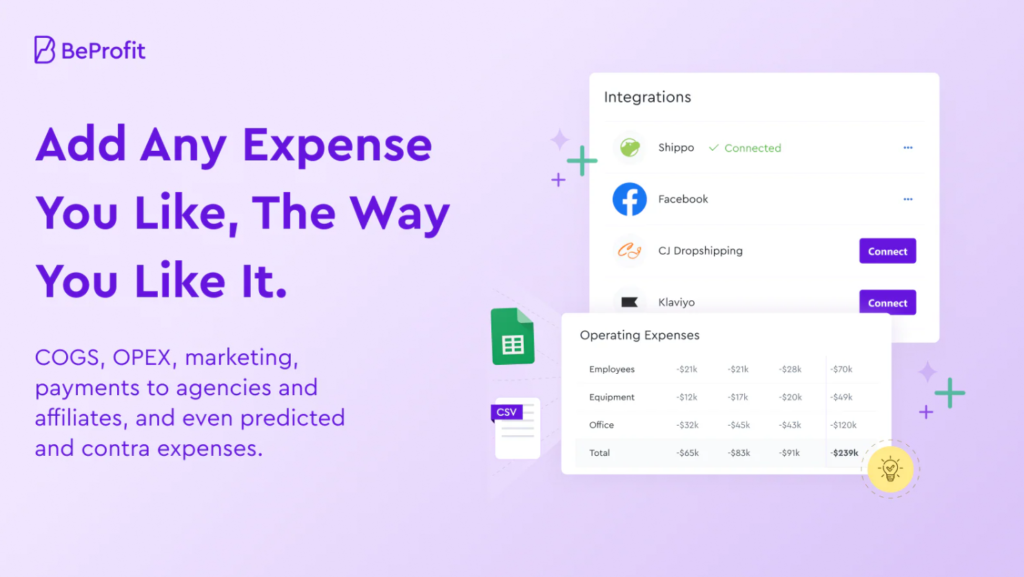
9. BeProfit: Real-Time Profit Analytics and Cost Tracking
Best For: Merchants obsessed with accurate profit tracking across all cost categories
BeProfit solves the problem that keeps ecommerce merchants up at night: knowing your actual profit. While Shopify shows revenue, BeProfit shows net profit—the money left after all costs. This is the financial metric that actually matters for business viability.
Key Features:
Real-Time Profit and Loss Dashboard: Live P&L statement updated with every order and expense entry
Automated Cost Tracking: Auto-syncs costs from advertising platforms (Google Ads, Facebook, TikTok, Pinterest, Bing), payment processors, and app subscriptions
Product-Level Profit Analysis: Calculate exact profit for each product; identify winners and losers
Order-Level Profitability: See profit from each individual order, not just aggregate data
Profit by Country/Channel: Understand which geographic markets and sales channels are most profitable
Multi-Store Management: View consolidated profit across all Shopify stores
Custom Cost Import: Add costs from Google Sheets or manual entry for complete financial accuracy
Live CPA and BCAC Tracking: Monitor cost-per-acquisition by channel and overall
LTV and Retention Metrics: Track customer lifetime value and repeat purchase rates
Advanced Features:
BeProfit includes profit forecasting based on current trends, seasonal adjustment factors for accurate year-over-year comparison, and profit analysis by customer segment—allowing you to identify which types of customers generate the most profit.
Pros:
Accurate Financial Clarity: Transforms Shopify’s revenue-only view into true profit perspective
Automated Ad Spend Tracking: Automatically pulls costs from Facebook, Google, TikTok, and others
User-Friendly Interface: Profit dashboard is intuitive and easy to understand
Detailed Cost Breakdown: See exactly how each cost category impacts profitability
Multi-Platform Support: Works with Amazon, Facebook Shop, TikTok Shop, and other channels
14-Day Free Trial: Test with real data before committing
Excellent for Decision Making: Once you know true profit, pricing and budget decisions become much clearer
Cons:
Requires Cost Integration Setup: Maximum value requires connecting all cost sources; manual entry is tedious
Limited Customer Behavior Analytics: Focuses on profit; not as strong on customer behavior or retention metrics
Interface Can Feel Cluttered: Lots of data on screen can overwhelm new users
Requires Historical Cost Data: Accuracy improves over time as historical data accumulates
Pricing:
14-day free trial for annual plans
Plans start around $99/month for core profit tracking
Professional plans $299+/month for multi-store and advanced features
No free tier; requires paid subscription
When to Choose BeProfit: Choose BeProfit if accurate profit tracking is your priority, you need to understand true financial performance, or you want to ensure marketing budgets are spent on genuinely profitable customer acquisition.
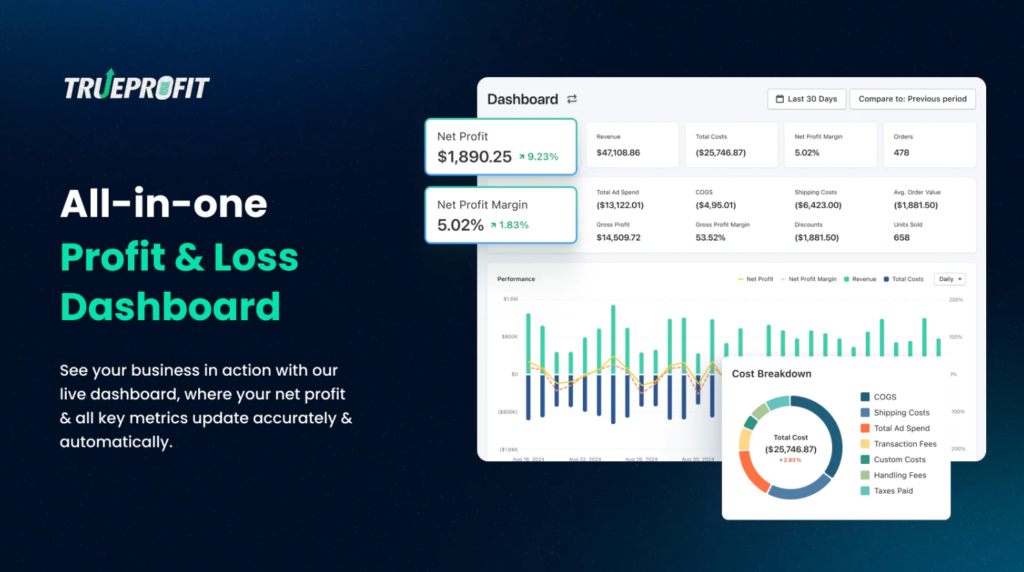
10. TrueProfit: Net Profit Analytics with Multi-Channel Cost Syncing
Best For: High-volume Shopify stores requiring comprehensive profit analysis and multi-channel financial reporting
TrueProfit positions itself as the “net profit analytics platform,” building from the ground up with one mission: help merchants understand their true profit. It’s particularly strong for stores managing complex cost structures across multiple advertising channels, payment processors, and business models.
Key Features:
Real-Time Net Profit Tracker: Profit dashboard updating continuously as orders flow in
Auto-Track All Costs: Automatically imports COGS, shipping costs, transaction fees, taxes, app subscriptions, and custom costs
Multi-Platform Ad Cost Syncing: Real-time sync of ad spend from Facebook, Google, TikTok, Bing, Snapchat, and Amazon Ads
Product-Level Profit Analytics: Identify genuinely profitable products vs. money-losers
Ad-Level Profitability: Calculate exact profit ROI for individual ads, campaigns, and ad accounts
Customer Lifetime Value with Profit Focus: Measure LTV based on profit, not revenue
Multi-Store Consolidation: Manage multiple Shopify stores with unified profit reporting
Interactive Performance Graphs: Visual trends showing profit patterns over time
Cost Breakdown Analysis: See exactly how each cost category impacts net profit
Repeat Purchase Tracking: Monitor which customers drive profitable repeat purchases
Advanced Features:
TrueProfit includes cash flow forecasting, scenario modeling (what if I decrease prices 10%?), seasonal profit analysis, profit-based cohort analysis, and predictive profit modeling for different business scenarios.
Pros:
Instant Financial Visibility: Know your real profit margin updated in real-time
Eliminates Manual Spreadsheets: No more error-prone Excel sheets; automatic cost tracking
Multi-Store Management: View all stores’ profitability from one dashboard
Cost Centralization: All 80+ integrated platform costs appear in one place
Performance Tracking Over Time: Interactive charts show profit trends and patterns
Budget Allocation Clarity: Knowing true profit per customer allows you to spend confidently on acquisition
Reduces Guesswork: Data-driven approach to pricing, discounting, and marketing spend
Cons:
Requires Careful Setup: Maximum accuracy requires properly integrating all cost sources
Pricing: Entry level plans $149+/month; can be expensive for smaller stores
Learning Curve: Feature depth means time investment to master
Needs Historical Data: Accuracy and trend forecasting improve with several months of data
Pricing:
Free trial available (limited features)
Plans start at $149/month for core profit tracking
Advanced plans $299-600+/month for multi-store and predictive features
Enterprise custom pricing available
When to Choose TrueProfit: Choose TrueProfit if you’re a high-volume seller needing comprehensive profit analytics, running complex marketing campaigns across multiple channels, or if accurate net profit is critical to your decision-making.
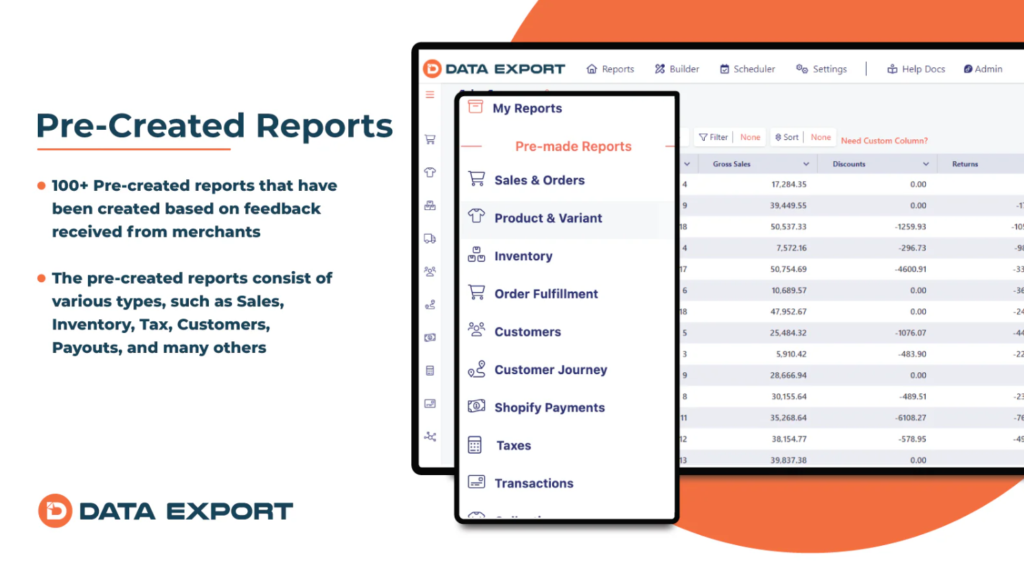
11. Data Export IO: Advanced Automation for Custom Reporting
Best For: Merchants needing automated, custom reporting with flexible export options and multi-store capabilities
Data Export IO approaches analytics from a different angle: instead of pre-built dashboards, it offers custom report builders with powerful automation. Build exactly the report you need, schedule it to auto-run, and receive it via email, FTP, Google Sheets, or other destinations.
Key Features:
Pre-Made Reports with 2000+ Exportable Fields: Access to comprehensive reports covering sales, taxes, inventory, POS, payouts, orders, customers, refunds, and more
Powerful Report Builder: Drag-and-drop interface to create custom reports with live record previews and line item details
Advanced Filtering: Add multiple conditions to segment exactly the data you need
Column Management: Freeze, filter, rename, sort, clone, and hide fields within reports
Flexible Summarization: Summarize data by week, month, or quarter for period comparisons
Multiple Export Formats: Download reports as Excel, CSV, or PDF
Automated Scheduling: Schedule reports to run and auto-send via email, FTP, Google Sheets/Drive, or Feeds
Multi-Store Reporting: Consolidate data from multiple Shopify stores into unified reports
Custom Field Support: Include custom metafields and custom fields in reports
Expert Assistance Included: Free help creating specialized, tailored reports
Advanced Features:
Data Export IO includes data import capabilities (import Google Sheets data into reports), scheduled exports to automated spreadsheet updates, POS integration for unified retail+online reporting, and inventory feed generation for marketplace optimization.
Pros:
Maximum Customization: Build any report you can imagine with full control
Expert Support Included: Live chat experts help create custom reports same-day
Automated Delivery: Set and forget; reports automatically deliver on schedule
Excellent for Agencies: Multi-store management and white-label reporting options
Multiple Export Options: Send reports to wherever your team manages data
Transparent Data Access: 2000+ fields means nothing is hidden or restricted
Flexible Scheduling: Simple to complex scheduling options
Cons:
Steeper Setup Learning Curve: Requires time to learn the report builder and understand available fields
Not a Dashboard Tool: Focuses on report export, not dashboard visualization
Best for Technical Users: While no coding required, report building requires analytical thinking
Limited to Pre-Set Integrations: Can’t export to custom APIs without manual intervention
Pricing:
Free trial available
Plans start around $99/month for core features
Professional plans $300+/month for advanced automation and higher export volume
100+ pre-made reports available to get started quickly
When to Choose Data Export IO: Choose Data Export IO if you need highly customizable reporting, want to automate complex data exports, or manage multi-store operations requiring tailored reports for different stakeholders.
Reportgenix: AI-Powered Custom Reports with Genix AI Assistant
Reportgenix brings artificial intelligence directly to Shopify analytics. Its standout feature is Genix AI—an AI assistant that answers questions about your store like “What products are underperforming this week?” or “Which customers are at highest churn risk?” in natural language.
Why Consider It:
100+ pre-built reports across sales, inventory, customers, and profitability
AI-powered insights and automated anomaly detection
Drag-and-drop custom report builder
Automated scheduling with email and Slack delivery
Multi-currency support for international stores
Real-time dashboards with interactive charts
Best For: Merchants who want AI-assisted analytics without the technical setup required by enterprise platforms.
Reveal by Omniconvert: Customer Data Platform for CLV Optimization
Reveal focuses specifically on customer lifetime value improvement through RFM segmentation, cohort analysis, and behavioral tracking.
Inventory Turnover Rate: COGS / Average inventory value
Stockout Frequency: How often products sell out
Inventory Carrying Cost: Total holding costs / Average inventory value
Implementation Roadmap: Getting Started with Advanced Analytics
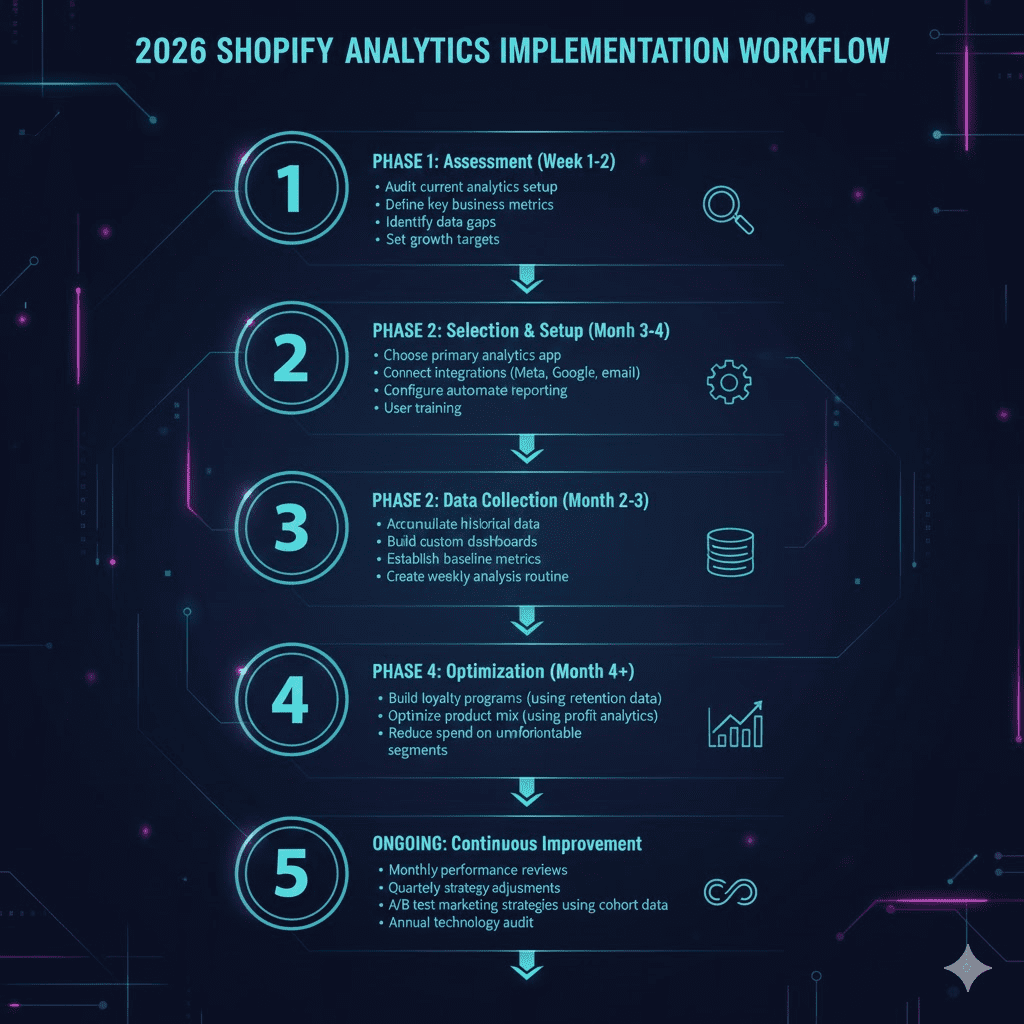
Month 1: Foundation
Choose your primary analytics app based on business priorities
Set up integrations (advertising platforms, email, payment processors)
Establish baseline metrics and KPIs
Create a data dictionary defining what each metric means
Month 2: Expansion
Add a secondary analytics tool if needed
Set up automated reporting schedules
Train your team on dashboard usage
Create a weekly reporting routine
Month 3: Optimization
Analyze 3 months of data to identify patterns
Use cohort analysis to understand customer behavior
Start making data-driven decisions on pricing, discounts, and marketing
Set growth targets based on data insights
Month 4+: Strategic Use
Implement predictive analytics for demand forecasting
Use retention analytics to build loyalty programs
Optimize product mix based on profitability data
Scale acquisition channels with the highest-value customers
2026 Analytics Trends You Must Know
AI-Driven Insights Become Standard
The future of analytics isn’t dashboards you check—it’s AI that checks your data automatically and tells you what to do. By 2026, most advanced analytics apps will include AI-powered recommendations, anomaly detection, and predictive modeling as baseline features.
Privacy-First Analytics
With third-party cookies deprecating and privacy regulations tightening (GDPR, CCPA expansion), analytics platforms increasingly focus on first-party data. Server-side tracking and consent-based analytics replace cookie-dependent tracking. Merchants who adapt early gain a competitive advantage.
Omnichannel Becomes Mandatory
Single-channel reporting is obsolete. Stores selling on Shopify, Amazon, TikTok Shop, and Facebook Shop simultaneously require analytics that consolidate all channels into one view. Omnichannel analytics aren’t optional—they’re essential.
Predictive Analytics Go Mainstream
Demand forecasting, churn prediction, and revenue forecasting move from enterprise-only features to standard app capabilities. Merchants use predictive insights to optimize inventory, prevent customer loss, and forecast cash flow.
Cohort Analysis Replaces Aggregate Metrics
Understanding how different customer cohorts behave—and how they differ from each other—replaces looking at aggregate store metrics. Cohort analysis reveals which acquisition channels deliver the most valuable customers, not just the cheapest.
Profit-Focused Analytics Win
As margins tighten, “vanity metrics” like revenue and order count matter less. Profit-focused analytics showing true financial performance become critical decision-making tools. Stores that can’t measure profitability accurately can’t survive.
Mind Map 2: 2026 Analytics Implementation Workflow
Conclusion: Your Analytics Competitive Advantage in 2026
In 2026, the e-commerce landscape will have become intensely competitive. Stores no longer compete just on product or marketing—they compete on data intelligence. Merchants with superior analytics can identify profitable customer segments faster, optimize marketing spend more effectively, predict trends before competitors, and scale faster with less waste.
Shopify’s native analytics provide a foundation, but they’re insufficient for modern growth. Third-party advanced analytics apps unlock insights that separate thriving stores from struggling ones. The difference isn’t just numbers on a dashboard—it’s the ability to make faster, better decisions based on comprehensive data.
The ten apps covered in this guide represent the best-in-class solutions for advanced Shopify analytics in 2026. Each serves different business models and priorities:
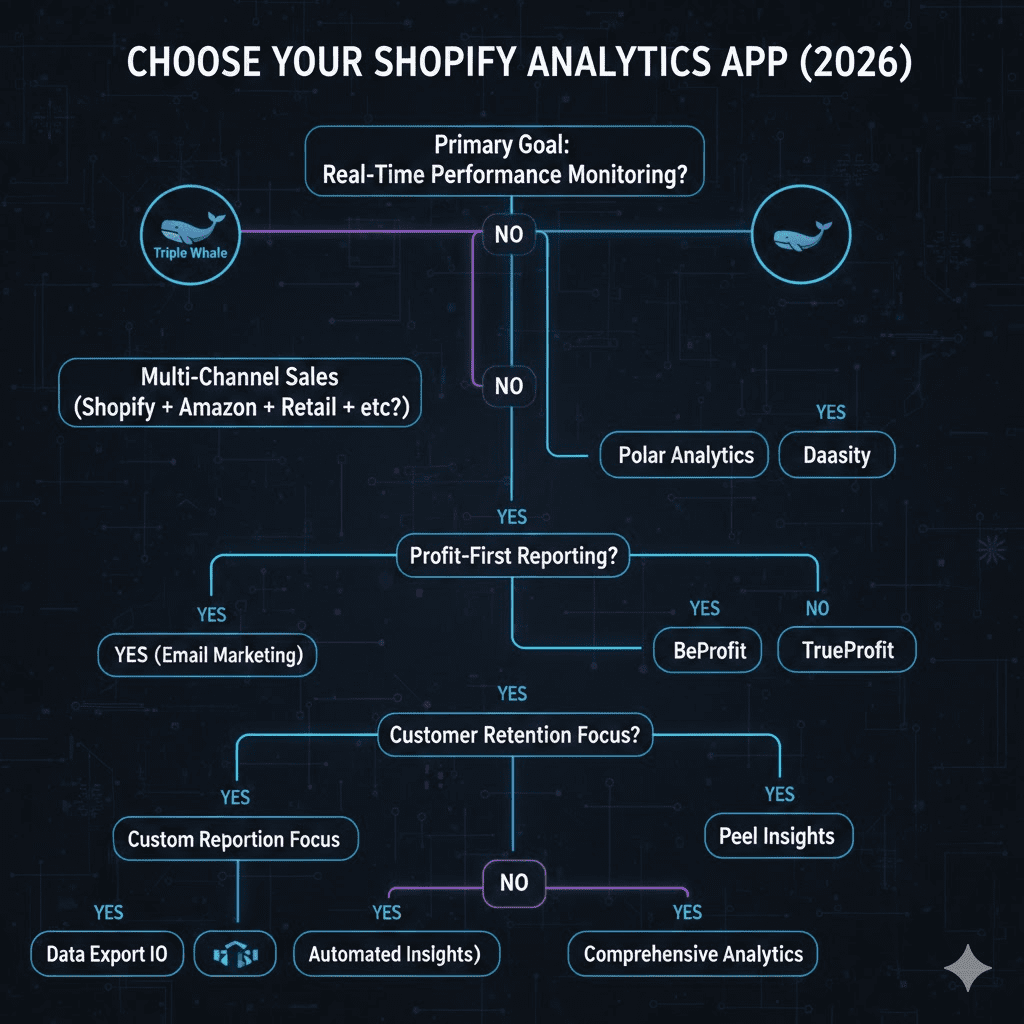
Triple Whale for DTC brands optimizing paid media
Polar Analytics for multi-channel consolidation
Lifetimely for retention and LTV obsession
Daasity for enterprise-scale operations
Segments Analytics for email-driven retention
Peel Insights for automated reporting efficiency
Metorik for comprehensive analytics + automation
BeProfit for profit-centric decision-making
TrueProfit for high-volume profit tracking
Data Export IO for custom reporting flexibility
The real competitive advantage in 2026 isn’t choosing one app—it’s choosing the right combination and implementing a systematic process to act on the insights they reveal. Start with your primary goal (profit, retention, growth, etc.), select the most relevant app, and commit to weekly data reviews that drive business decisions.
The merchants who build strong analytics practices in 2026 won’t just see modest growth—they’ll compound competitive advantages month after month. Analytics isn’t a nice-to-have feature; it’s the foundation of sustainable ecommerce success.