
A loyalty program KPI is a single number you track, such as redemption rate or repeat purchase rate. A loyalty program report groups several KPIs to answer one business question on a set schedule, such as “do members come back more often than non-members?” KPIs tell you what changed. Reports tell you why and what to do next.
Loyalty Program Analytics: The KPIs and Reports That Matter
Your loyalty dashboard says 3,000 customers joined this quarter and 180,000 points were issued. Then someone asks the only question that matters: did the program make the store more money? Most merchants can’t answer, because their loyalty program analytics track activity instead of results. The fix isn’t more data. It’s a short list of KPIs and a few reports, each tied to a decision you’ll actually make.
Table of contents
- Key takeaways
- What is loyalty program analytics?
- Which loyalty program KPIs actually matter?
- Which loyalty program reports should you run, and how often?
- Which loyalty program reports should you run, and how often?
- How do you set up loyalty program analytics on Shopify?
- Fewer metrics, better decisions
Key takeaways
- Track 8 KPIs, not 30.
- Run 6 reports on a fixed schedule.
- Compare members with similar non-members, always.
- Treat unspent points as a future cost.
- Every report needs an owner and a decision.
What is loyalty program analytics?
Loyalty program analytics is the practice of measuring how a rewards program changes customer behavior and profit. It covers three levels: activity (sign-ups, points earned), behavior (repeat orders, redemptions) and profit (incremental revenue minus reward costs). Activity metrics are easy to collect. Profit metrics are the ones that justify the program.
The stakes are higher than they look. Forrester reported in 2024 that 85% of US online adults belong to at least one retail loyalty program, and the 2025 Bond Loyalty Report found the average consumer belongs to 17.4 programs. Your program competes with more than a dozen others for the same customer’s attention. Good analytics show whether yours is winning that competition or just handing out points.
Which loyalty program KPIs actually matter?
The loyalty program KPIs that matter are the ones that change a decision: enrollment rate, active member rate, redemption rate, repeat purchase rate, member AOV, incremental revenue, reward cost as a share of member revenue and outstanding points liability. Everything else is supporting detail. If a metric moves and you wouldn’t change anything, drop it from your dashboard.
| KPI | What it measures | Decision it drives |
|---|---|---|
| Enrollment rate | Share of customers who join the program | Whether to change how and where you promote sign-up |
| Active member rate | Share of members who earned or redeemed in the last 90 days | Whether to run a re-engagement campaign |
| Redemption rate | Points redeemed ÷ points issued | Whether rewards are too hard or too easy to reach |
| Repeat purchase rate | Members vs non-members who order again within a set window | Whether the program drives second and third orders |
| Member AOV | Average order value of members vs non-members | Whether rewards push basket size or just discount it |
| Incremental revenue | Member revenue above a matched control group | Whether the program creates sales or relabels them |
| Reward cost % | Reward and coupon costs ÷ member revenue | Whether rewards are eating your margin |
| Points liability | Value of unredeemed points still outstanding | How much future cost you’re carrying |
Which loyalty program reports should you run, and how often?
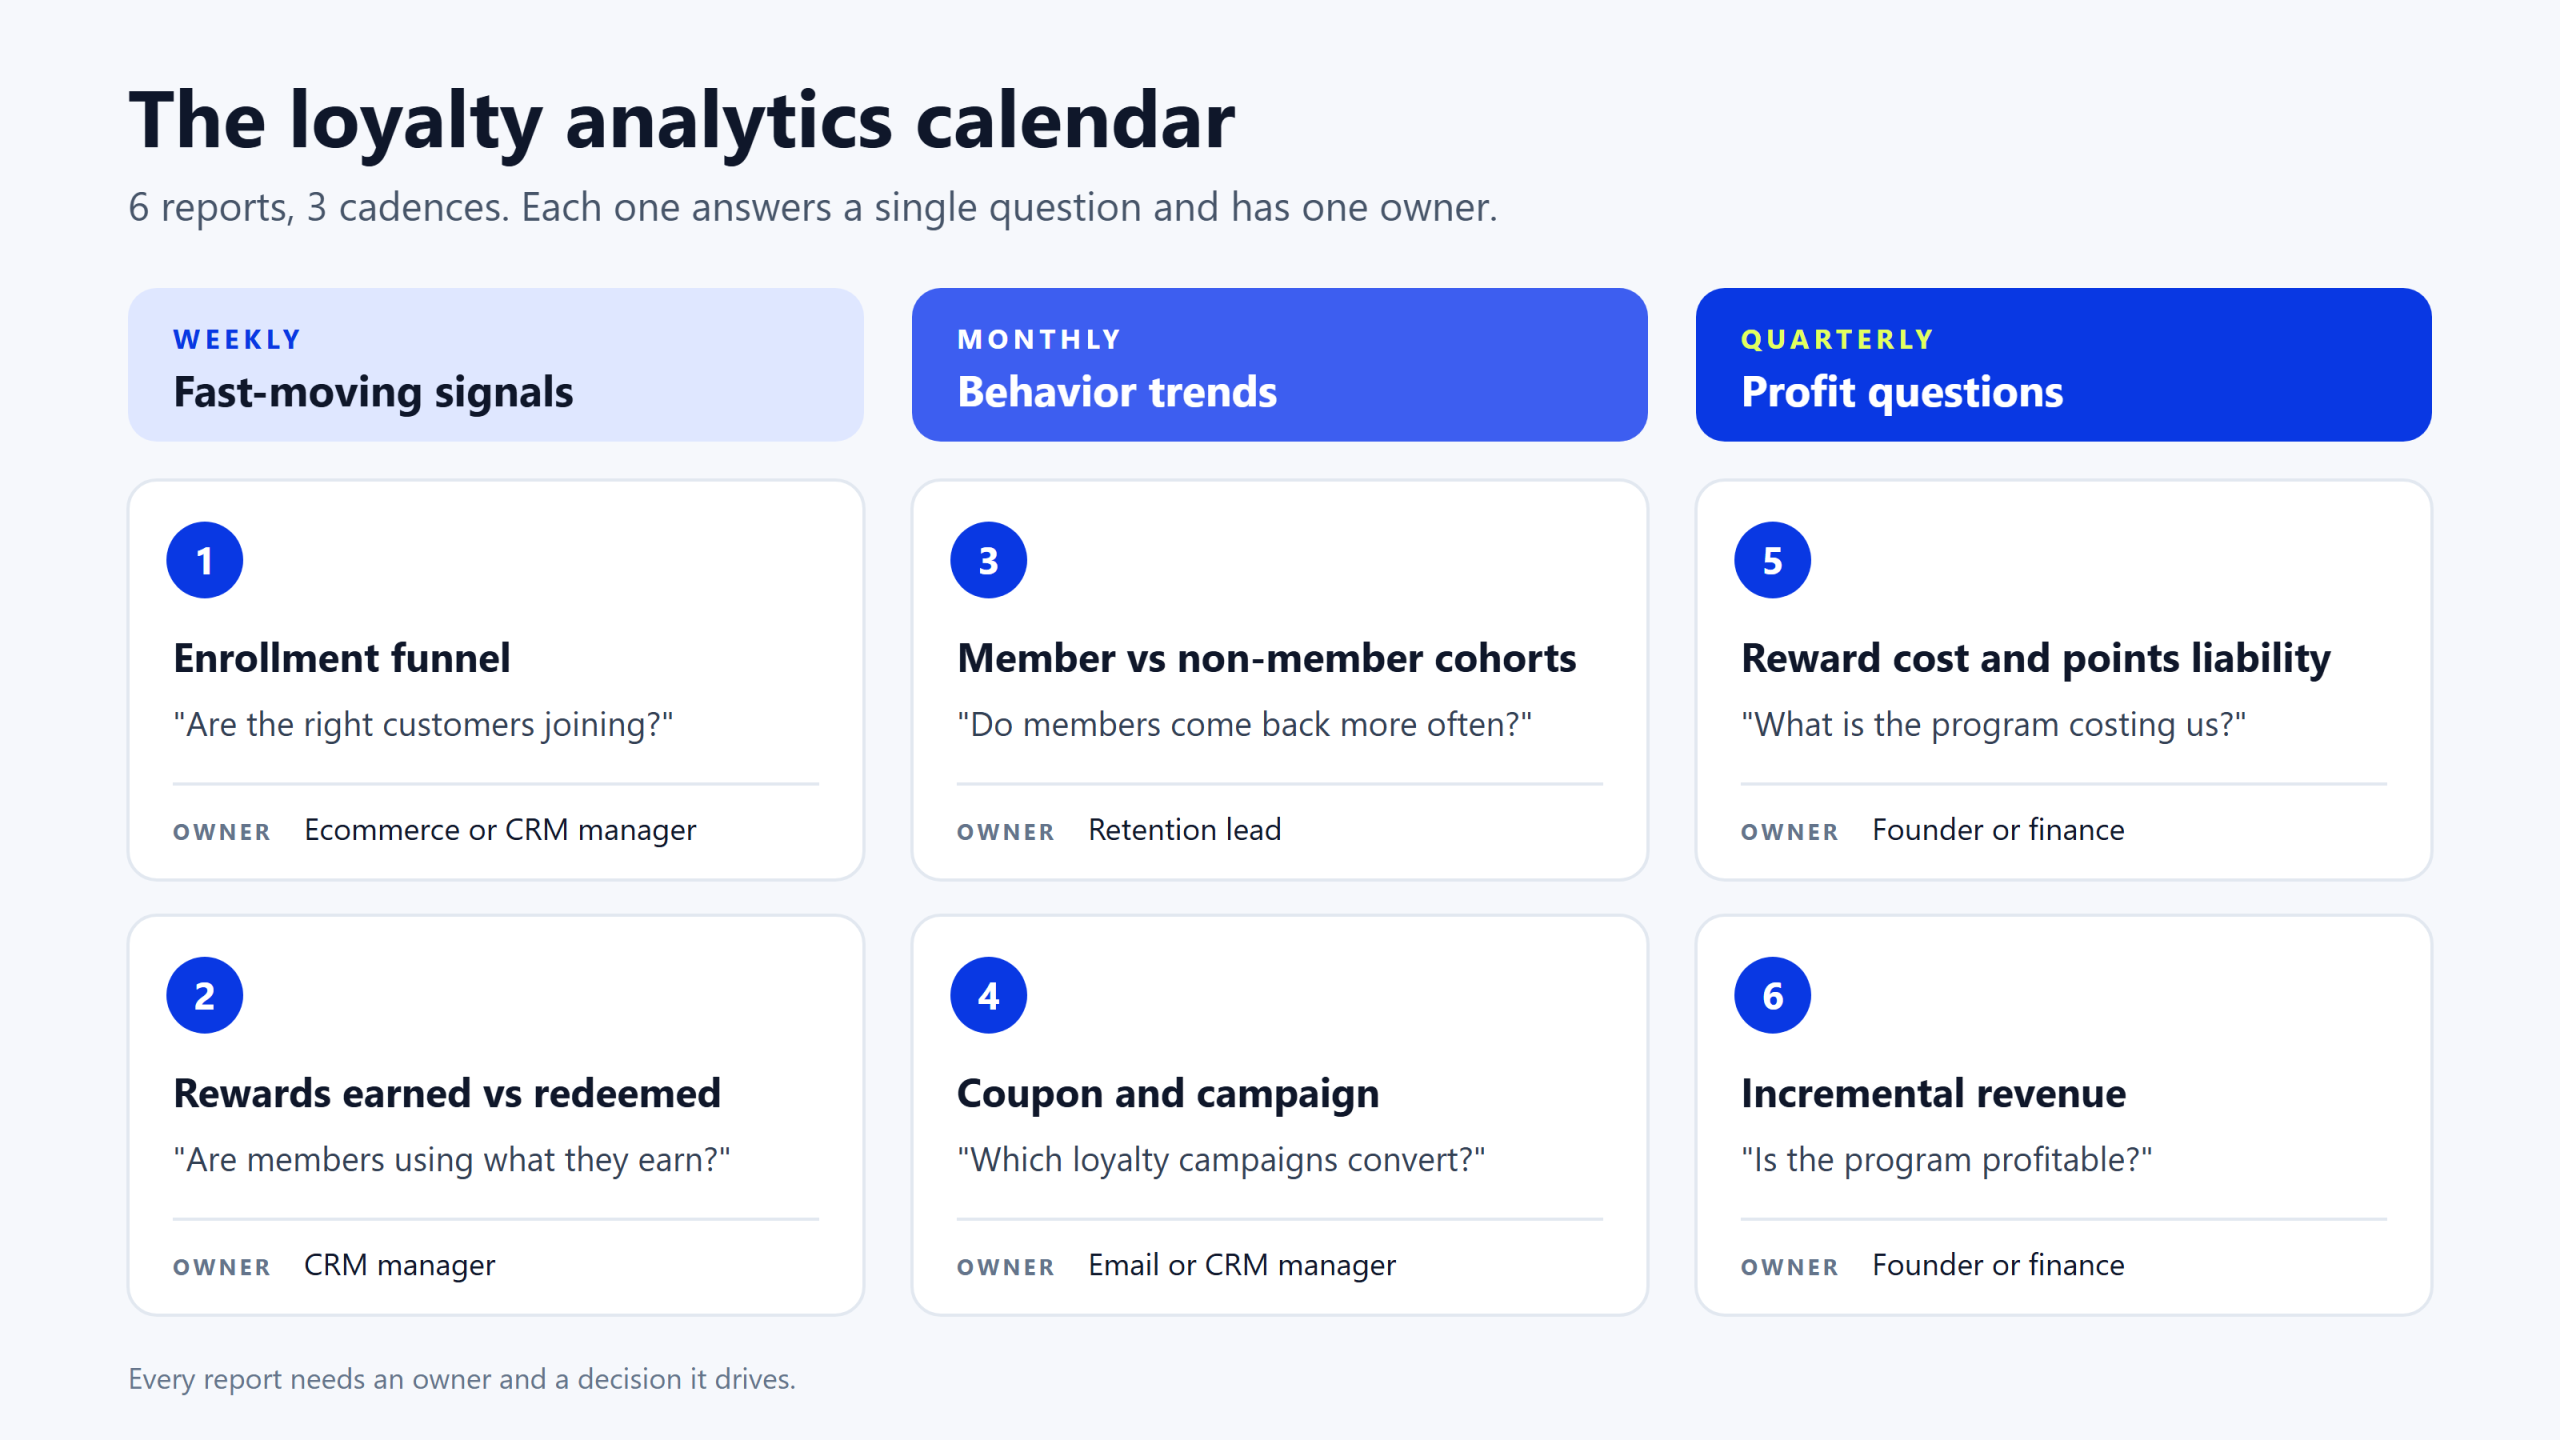
Run six loyalty program reports on a fixed schedule. Each week, check the enrollment funnel and rewards earned vs redeemed. Each month, check the member vs non-member cohort report and the coupon and campaign report. Each quarter, check reward cost with points liability, and incremental revenue. Fast-moving signals get weekly checks. Profit questions need enough data, so they get quarterly ones.
| Report | Cadence | Question it answers | Owner |
|---|---|---|---|
| Enrollment funnel | Weekly | Are the right customers joining? | Ecommerce or CRM manager |
| Rewards earned vs redeemed | Weekly | Are members using what they earn? | CRM manager |
| Member vs non-member cohorts | Monthly | Do members come back more often? | Retention lead |
| Coupon and campaign | Monthly | Which loyalty campaigns convert? | Email or CRM manager |
| Reward cost and points liability | Quarterly | What is the program costing us? | Founder or finance |
| Incremental revenue | Quarterly | Is the program profitable? | Founder or finance |
1. Enrollment funnel report (weekly)
This report shows how many customers see the program, start to join and finish joining. Low completion usually means friction. Forced account creation is a common culprit. The Baymard Institute found that 18% of US shoppers who abandoned checkout did so because the site wanted them to create an account. If joining your program requires an account before checkout, offer it after the purchase instead.
2. Rewards earned vs redeemed report (weekly)
This report compares points earned with points redeemed, which gives you your redemption rate. A falling rate means members are collecting points they don’t plan to use, which usually means rewards are too far away or not worth the effort. Fix it by adding a lower reward tier, sending balance reminders or showing rewards on product pages with rewards placement.
3. Member vs non-member cohort report (monthly)
This is the most important behavior report. Group customers by the month of their first order. Then compare the repeat purchase rate and AOV of members and non-members in the same cohort at 30, 60 and 90 days. Comparing within cohorts removes the bias of comparing new non-members with members who have been around for years.
4. Coupon and campaign report (monthly)
This report tracks how many reward coupons were created and how many were used, broken down by campaign. If a points reminder email produces many coupons but few orders, the reward isn’t compelling. If one campaign converts far better than the others, move budget to it.
5. Reward cost and points liability report (quarterly)
This report adds up what rewards cost you and how much unredeemed value is still outstanding. Unspent points are a promise of future discounts, so they belong on your radar like any other cost. Under revenue recognition standards such as ASC 606, larger companies defer part of their revenue for loyalty points they’ve issued. A small store doesn’t need that formality, but it should know the number. Ask your accountant how this applies to your business.
6. Incremental revenue report (quarterly)
This report answers whether the program is profitable. Compare members with a matched control group of similar customers who weren’t offered the program or haven’t joined. Then subtract reward costs from the extra gross profit. For the full method, read our guide to the loyalty program ROI formula.
Go deeper: How to measure loyalty program success explains the full 3-layer KPI framework and a 90-day metrics roadmap.
How do you read loyalty program metrics without fooling yourself?
Read loyalty program metrics against a baseline, never in isolation. The three common traps are self-selection (your best customers join first), vanity totals (points issued says nothing about profit) and discount cannibalization (rewards given on orders that would have happened anyway). Each trap makes a program look healthier than it is.
The numbers in this example are hypothetical. Imagine a store where loyalty members generate 45% of revenue after one year. That sounds like a big win. But if the same customers already generated 38% of revenue before the program launched, the real shift is 7 percentage points, not 45. The dashboard number is true. It just answers the wrong question.
Here is how to avoid each trap:
- Self-selection: compare members only with similar non-members. Match them on first-order month, order count and spend before joining.
- Vanity totals: report points issued only next to points redeemed and revenue from redemptions. A big points total with low redemption is a warning sign, not a success.
- Discount cannibalization: check whether members who redeem a reward order more often over the next 90 days than members who don’t. If not, the reward may just be discounting orders you already had.
The 2025 Bond Loyalty Report found that only about 1 in 3 loyalty programs is seen as delivering true value. Honest analytics are how you find out which side of that line your program is on before your customers decide for you.
How do you set up loyalty program analytics on Shopify?
To set up loyalty program analytics on Shopify, record a baseline before launch, tag loyalty members so you can filter them, decide which customers form your control group and give each report an owner and a calendar slot. Then use your loyalty app’s dashboard for daily activity and run the quarterly profit reports from your order data.
- Record a baseline. Before launch, note your repeat purchase rate, AOV and the share of revenue from returning customers. Without it, you can’t measure change.
- Tag members. Make sure loyalty members are tagged in Shopify so you can segment orders and customers in reports.
- Define a control group. Pick customers with similar order history who haven’t joined, or hold back a small random group from promotions.
- Assign owners. Put each of the six reports on a calendar with one person responsible for acting on it.
- Use your loyalty dashboard for activity. Retenzy Loyalty Analytics shows revenue generated by the program, its share of total revenue, order volume, repeat purchase revenue, AOV, rewards earned vs redeemed and coupon usage in visual dashboards. That covers the data behind the weekly and monthly reports.
If the cohort report shows members drifting away after their first redemption, read our guide to the 5 signs a customer is about to churn and set up alerts for those signals.
Fewer metrics, better decisions
Loyalty program analytics pay off when every number leads to an action. Track eight KPIs, run six reports on a schedule and compare members with similar non-members every time. Start this week with the enrollment funnel and rewards earned vs redeemed, then add the profit reports once you have a full quarter of data.
FAQ
What is loyalty program analytics?
Loyalty program analytics is the measurement of how a rewards program affects customer behavior and profit. It tracks activity such as sign-ups and points earned, behavior such as repeat orders and redemptions, and profit such as incremental revenue minus reward costs. The goal is to show whether the program creates new sales or rewards purchases that would have happened anyway.
What is a good redemption rate for a loyalty program?
There’s no universal good redemption rate, because it depends on your reward thresholds and product prices. Watch the trend instead. A falling redemption rate means members are earning points they don’t value or can’t reach. A rising rate is healthy as long as reward cost stays within your margin. Compare the rate before and after every change to your rewards.
How often should you review loyalty program reports?
Review enrollment and redemption reports weekly, because they react fast to changes in promotion and rewards. Review member cohorts and campaign performance monthly. Review reward costs, points liability and incremental revenue quarterly, because profit trends need at least one full buying cycle of data before they’re reliable.
Which loyalty program analytics metric best shows ROI?
Incremental gross profit is the best single measure of ROI in loyalty program analytics. It compares members with a matched group of similar non-members, then subtracts reward and coupon costs from the extra profit members generate. Total member revenue overstates ROI because your most loyal customers tend to join first, and they were already buying.
What is the difference between loyalty program KPIs and loyalty program reports?
Increase Repeat Orders with Retenzy
Add points, referrals, and VIP rewards to your Shopify store in under 5 minutes.